Social media strategy, content production, and campaign analytics for SpurHacks, Canada's largest hackathon.
the problem
SpurHacks launched with no existing audience and a short runway to registration open. The goal was to reach real prospective participants, mostly Gen Z students already fluent in tech and CS culture, not just grow a follower count, before applications closed.
the approach
Matched the content to that audience: native short-form over polished production, behind-the-scenes over announcements. Produced 23 reels and built a content calendar around platform-native formats: event recaps, behind-the-scenes moments, team highlights, and countdown content as registration approached. Also worked directly in Figma with the team's graphic designer on story and feed graphics, writing the copy and editing layouts inside their template system. Pulled analytics weekly and adjusted: if something flatlined we moved on, if something performed we made more of it.
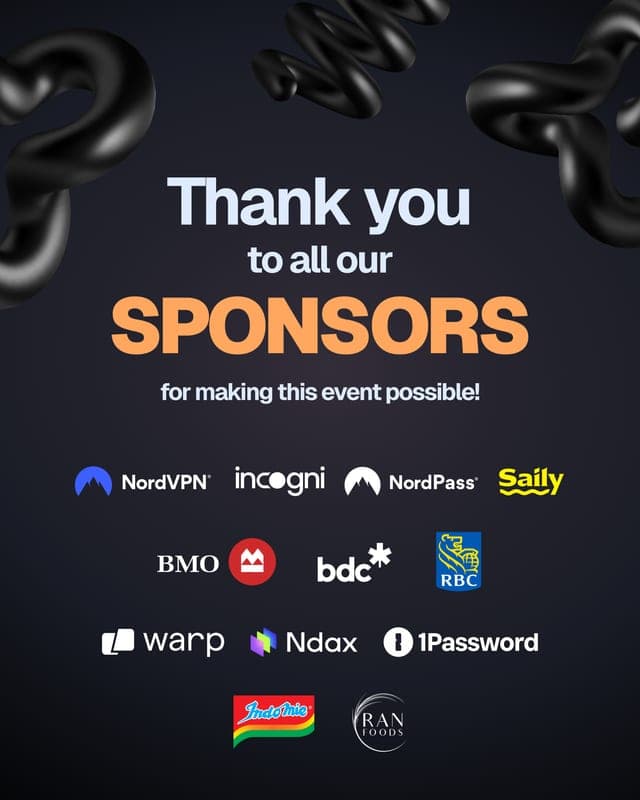
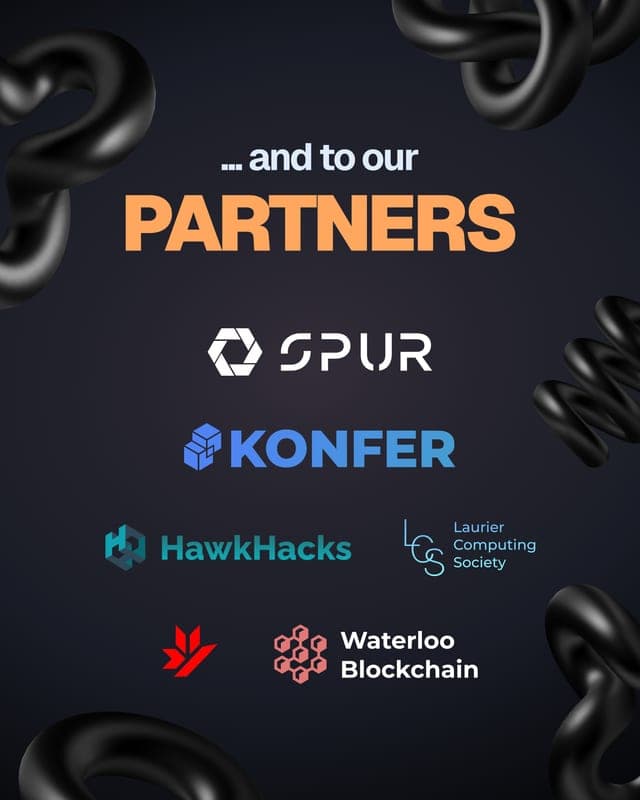
designed in figma
Working directly with the team's graphic designer in Figma, I wrote the copy and edited layouts for story and feed graphics using their template system.
created
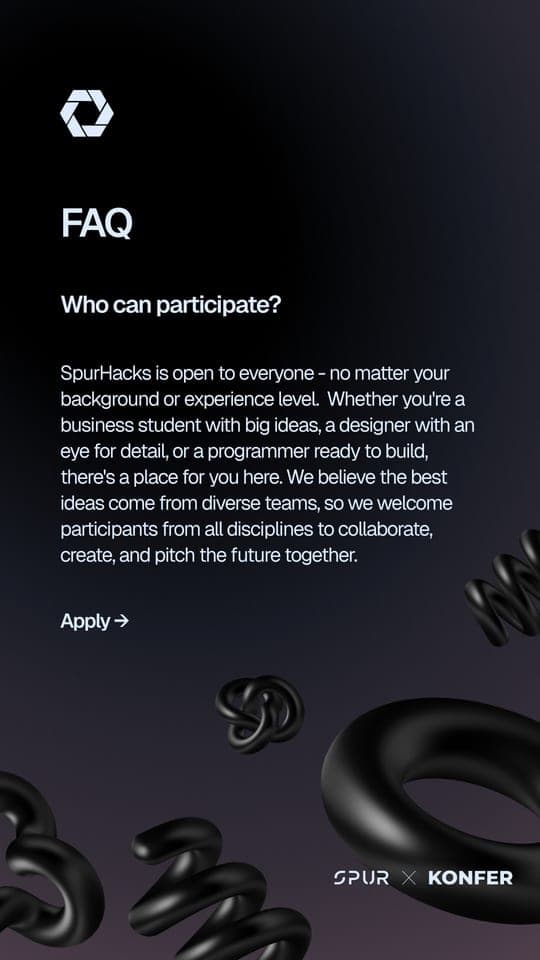
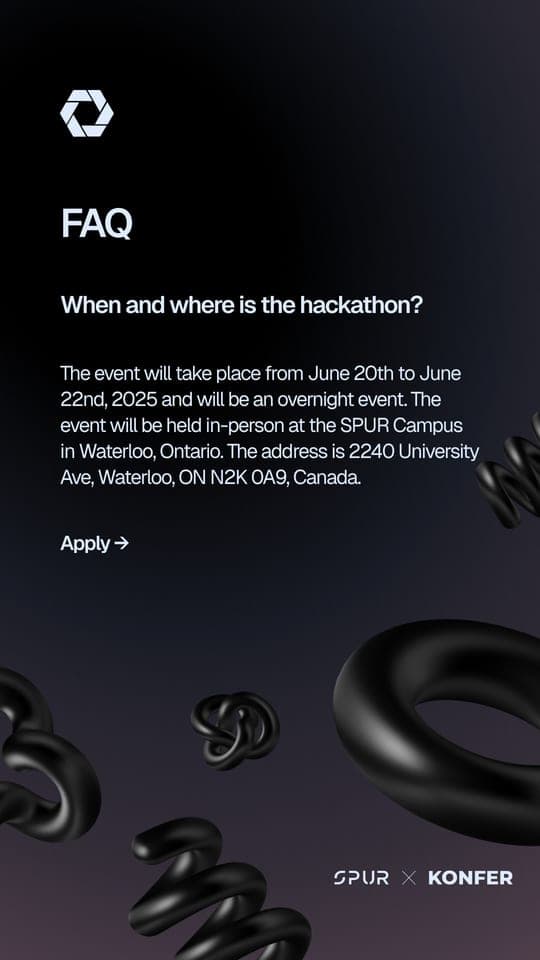
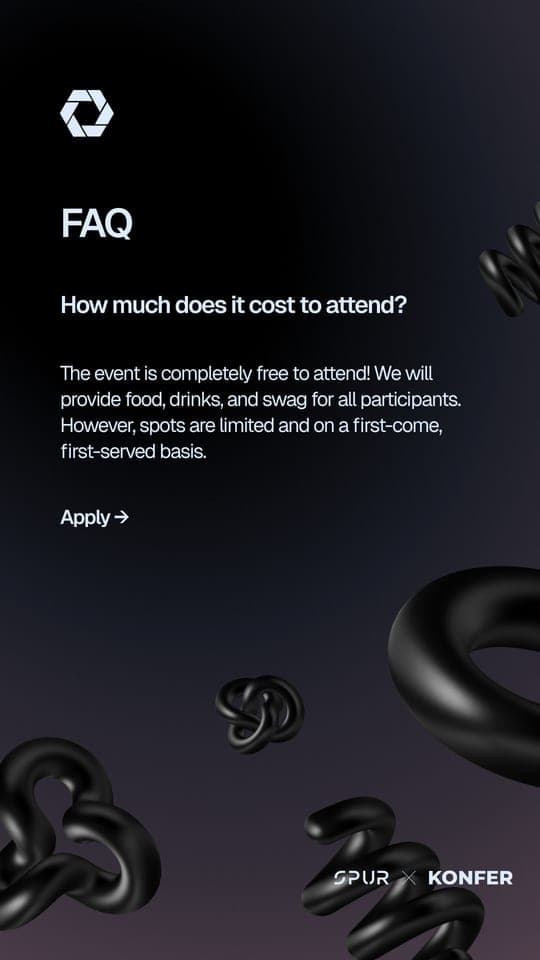
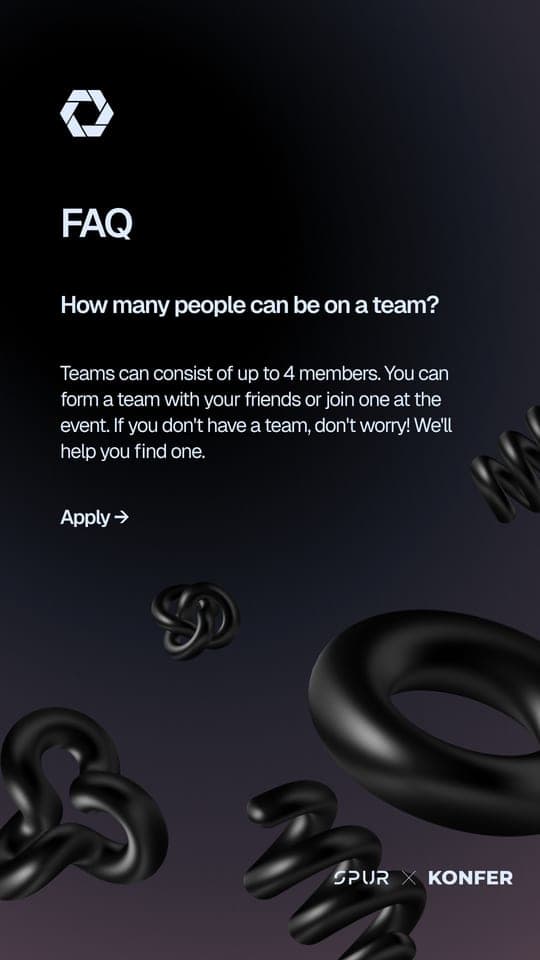
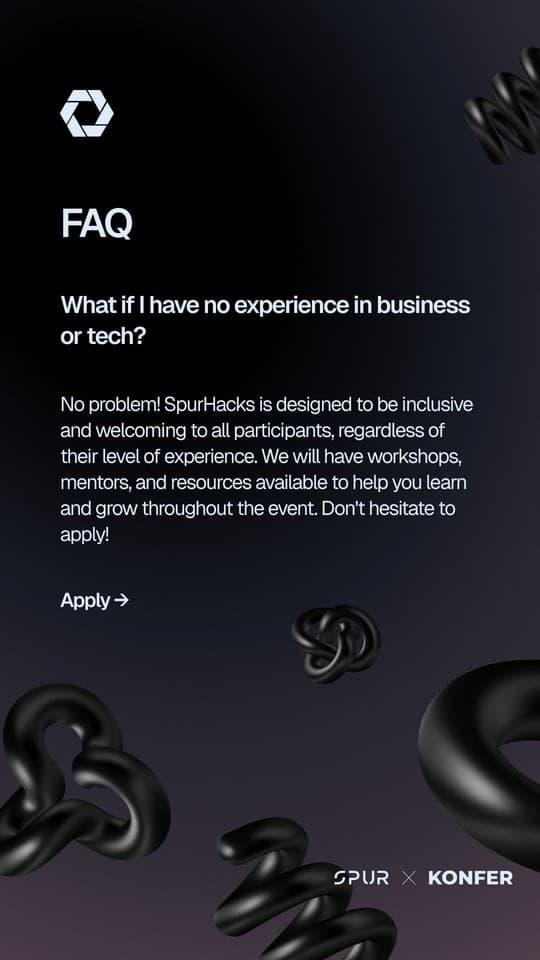
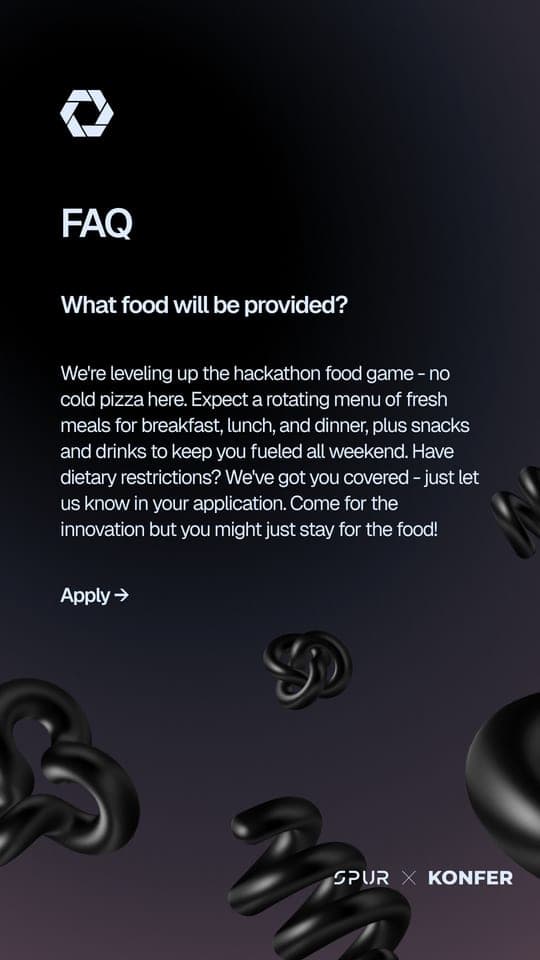
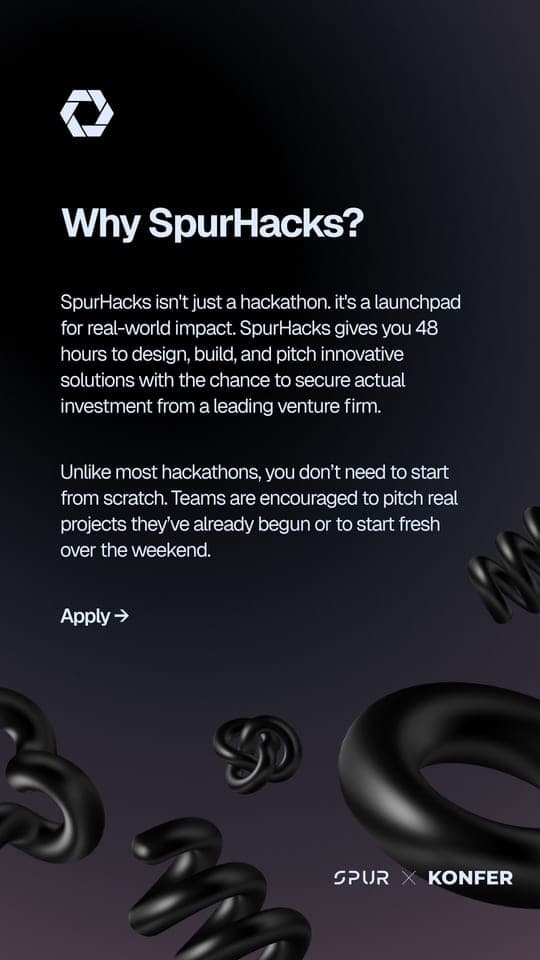
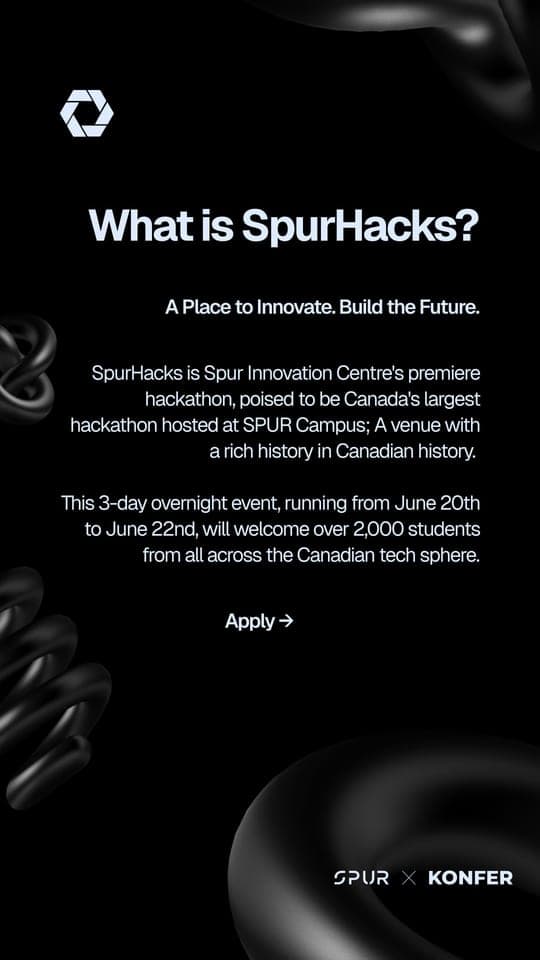
helped create
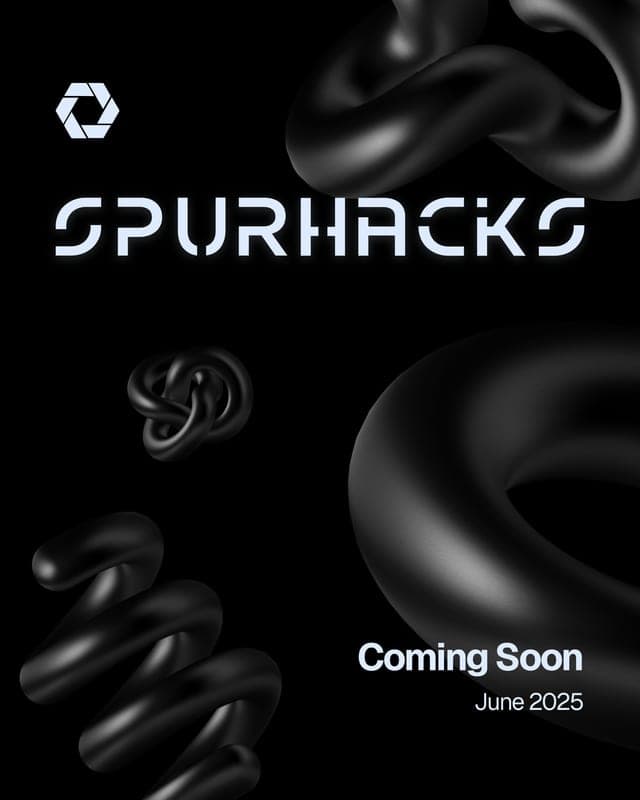
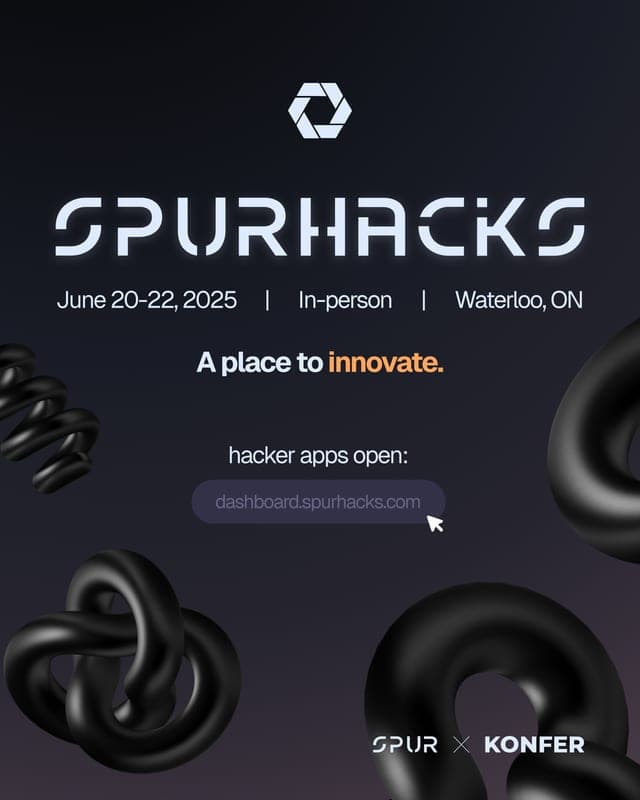
the teaser
how it happened
the process
Built a week-by-week content calendar phased around awareness, then interest, then registration deadline
Produced and edited short-form reels; event recaps, team moments, and behind-the-scenes content drove the most reach
Collaborated with the team's graphic designer in Figma on story and feed graphics, writing copy and editing layouts inside their template system
Pulled Instagram analytics weekly: reach, non-follower %, shares, and saves were the signals that mattered
Dropped formats that plateaued in the 2,000-4,000 view range and doubled down on shareable, visual content
Tracked registrant numbers alongside content output to connect posting activity to application volume
built with
next up