Case study 01 / Product design / 2026
CityRoots
Free things first, and nobody pays for placement.
A directory of free and low-cost things to do across the GTA and Waterloo Region. Every listing shows its cost, free comes first, and nobody pays for placement.
672places to explore across 10 cities
Role, status and stack
- Role
- Solo, product design and development
- Status
- Live; own domain and live payments still to come
- Made with
- Next.js / TypeScript / PostgreSQL / Drizzle ORM / Auth.js / Stripe / Playwright / Vitest
The problem
A directory is only useful if you can trust its order.
Free museum nights and swim times are scattered across blog lists that disagree with each other. CityRoots answers one question: what can I do this weekend, near me, and what will it cost? The decision everything else hangs on is that no payment, tier or partner deal can move a listing up, and a test fails if the ranking code ever reads one.
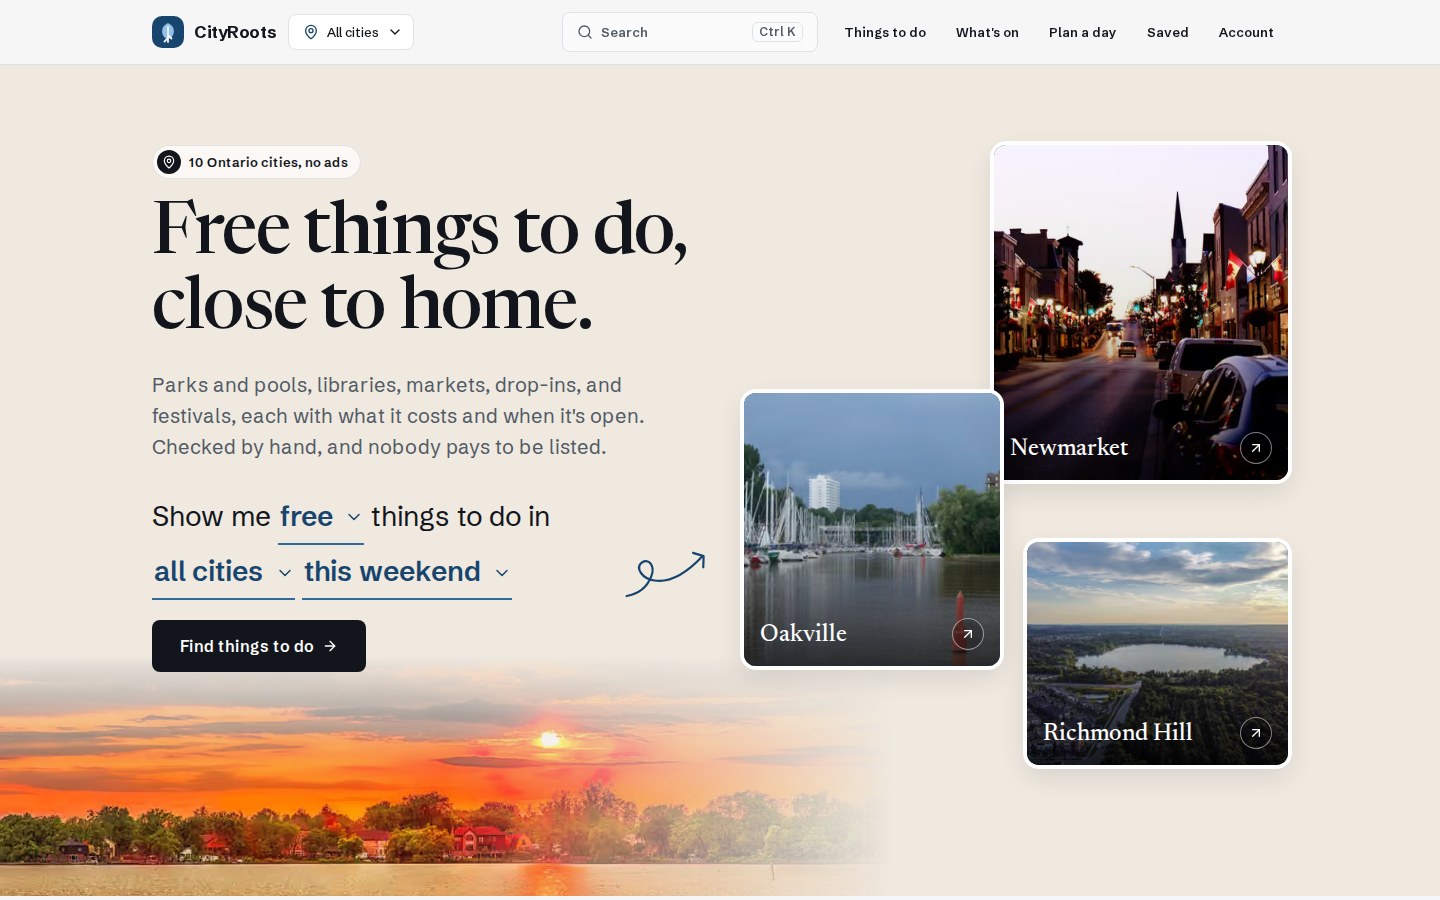
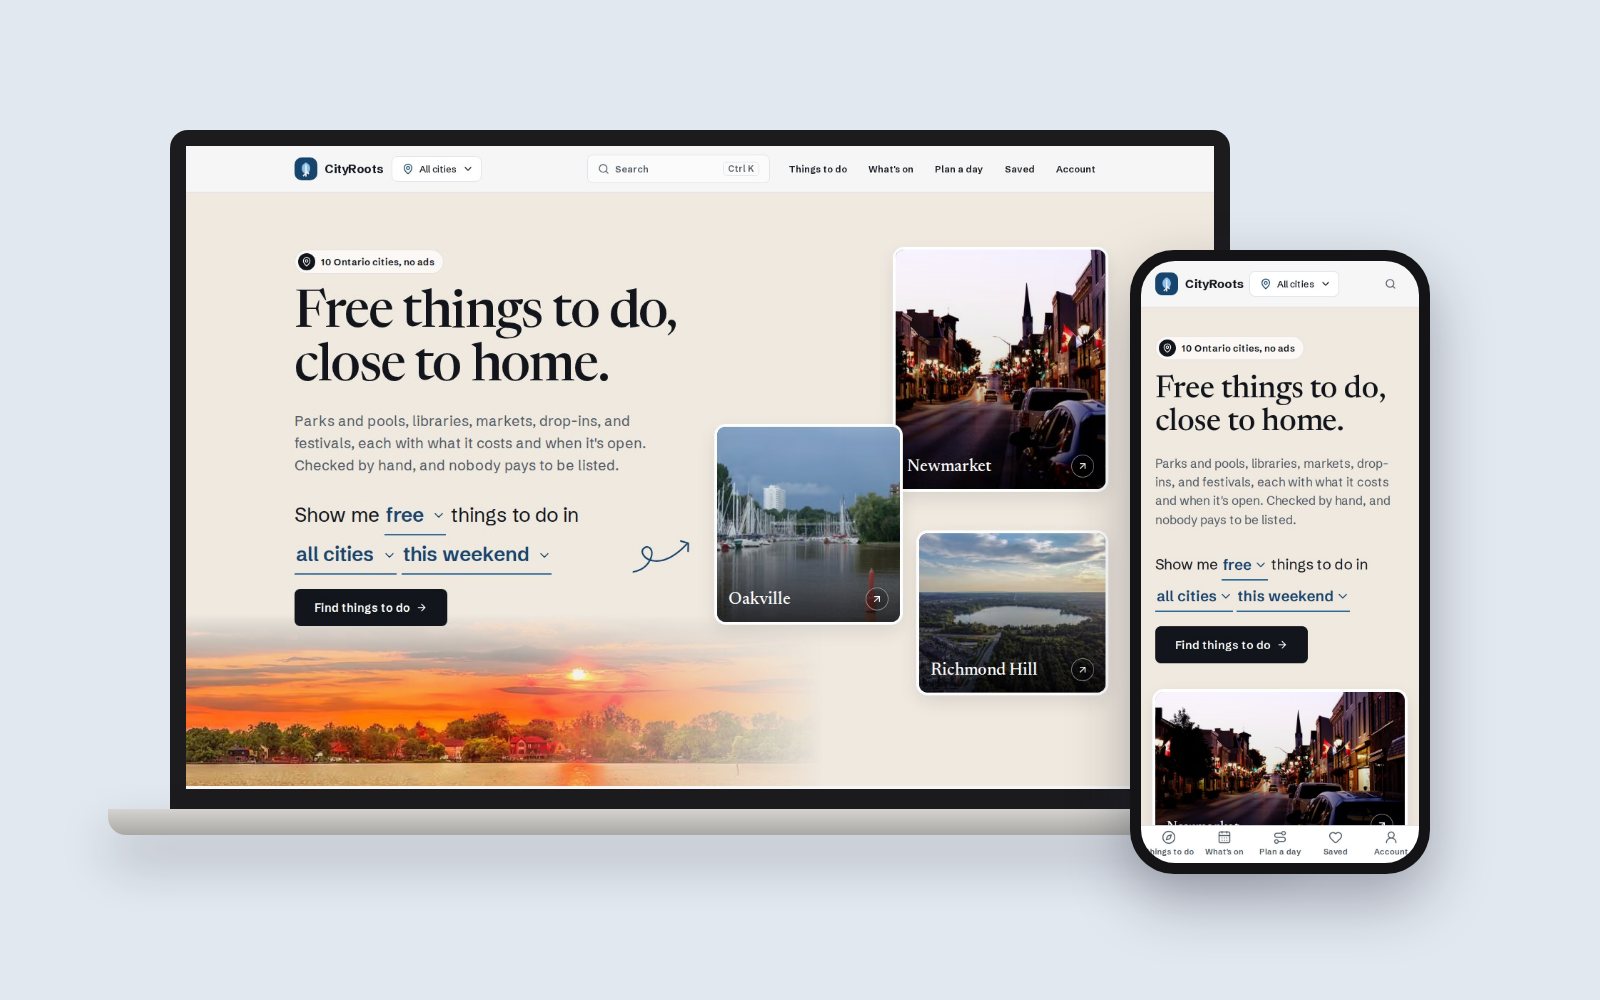
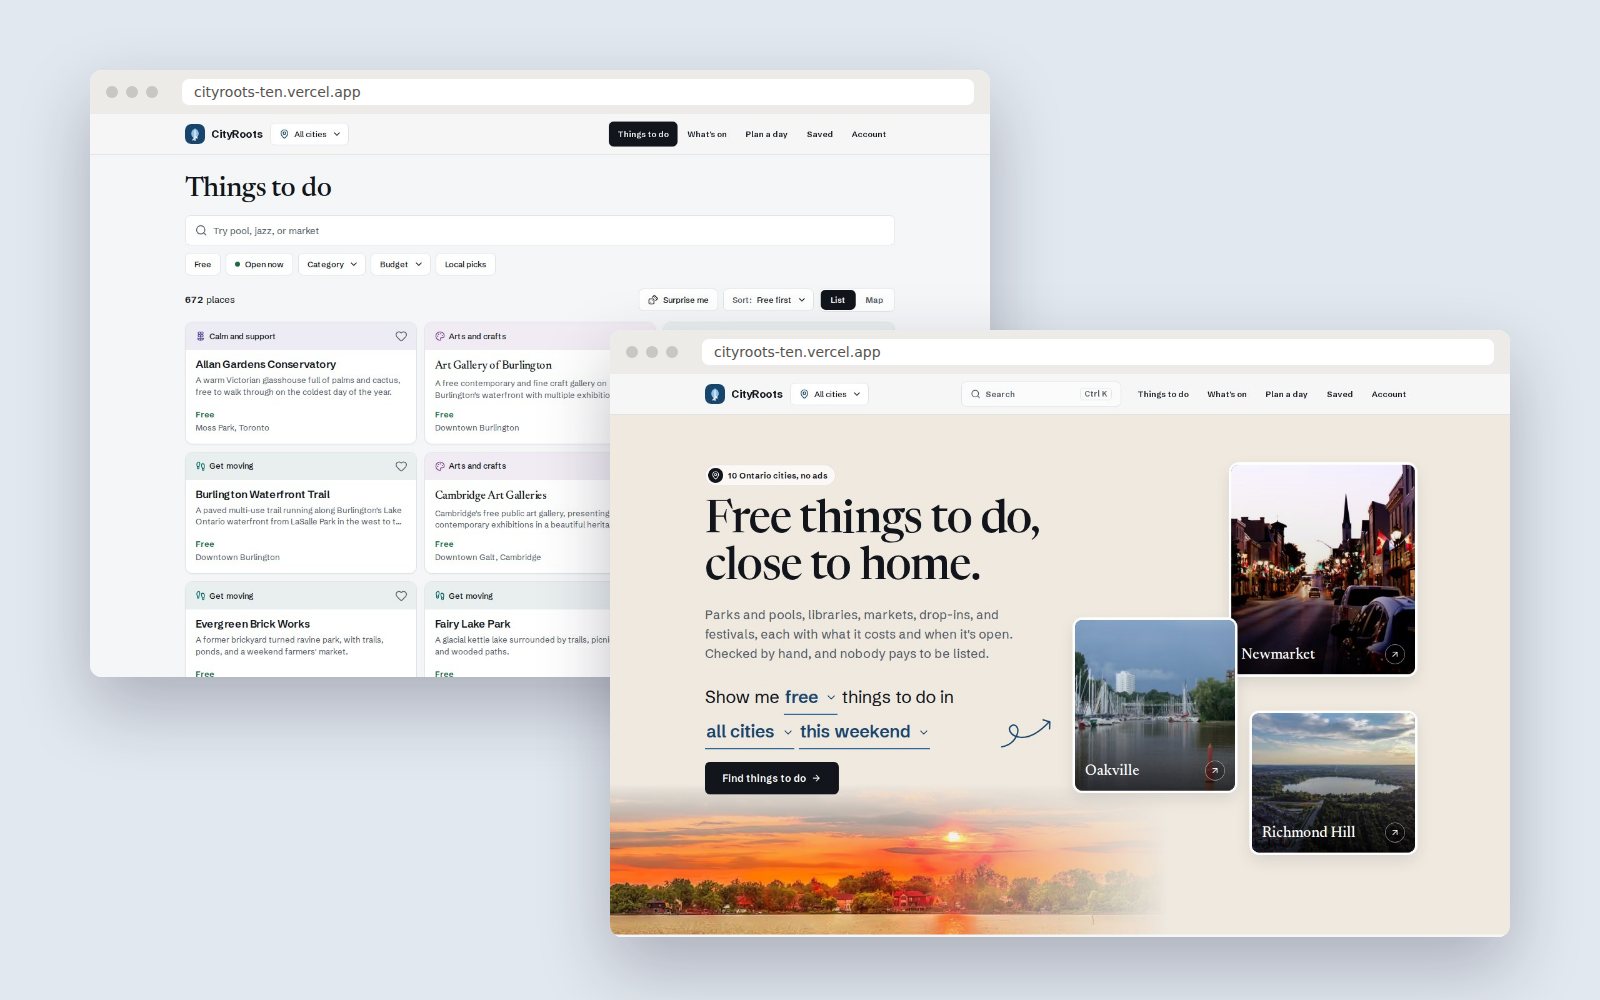
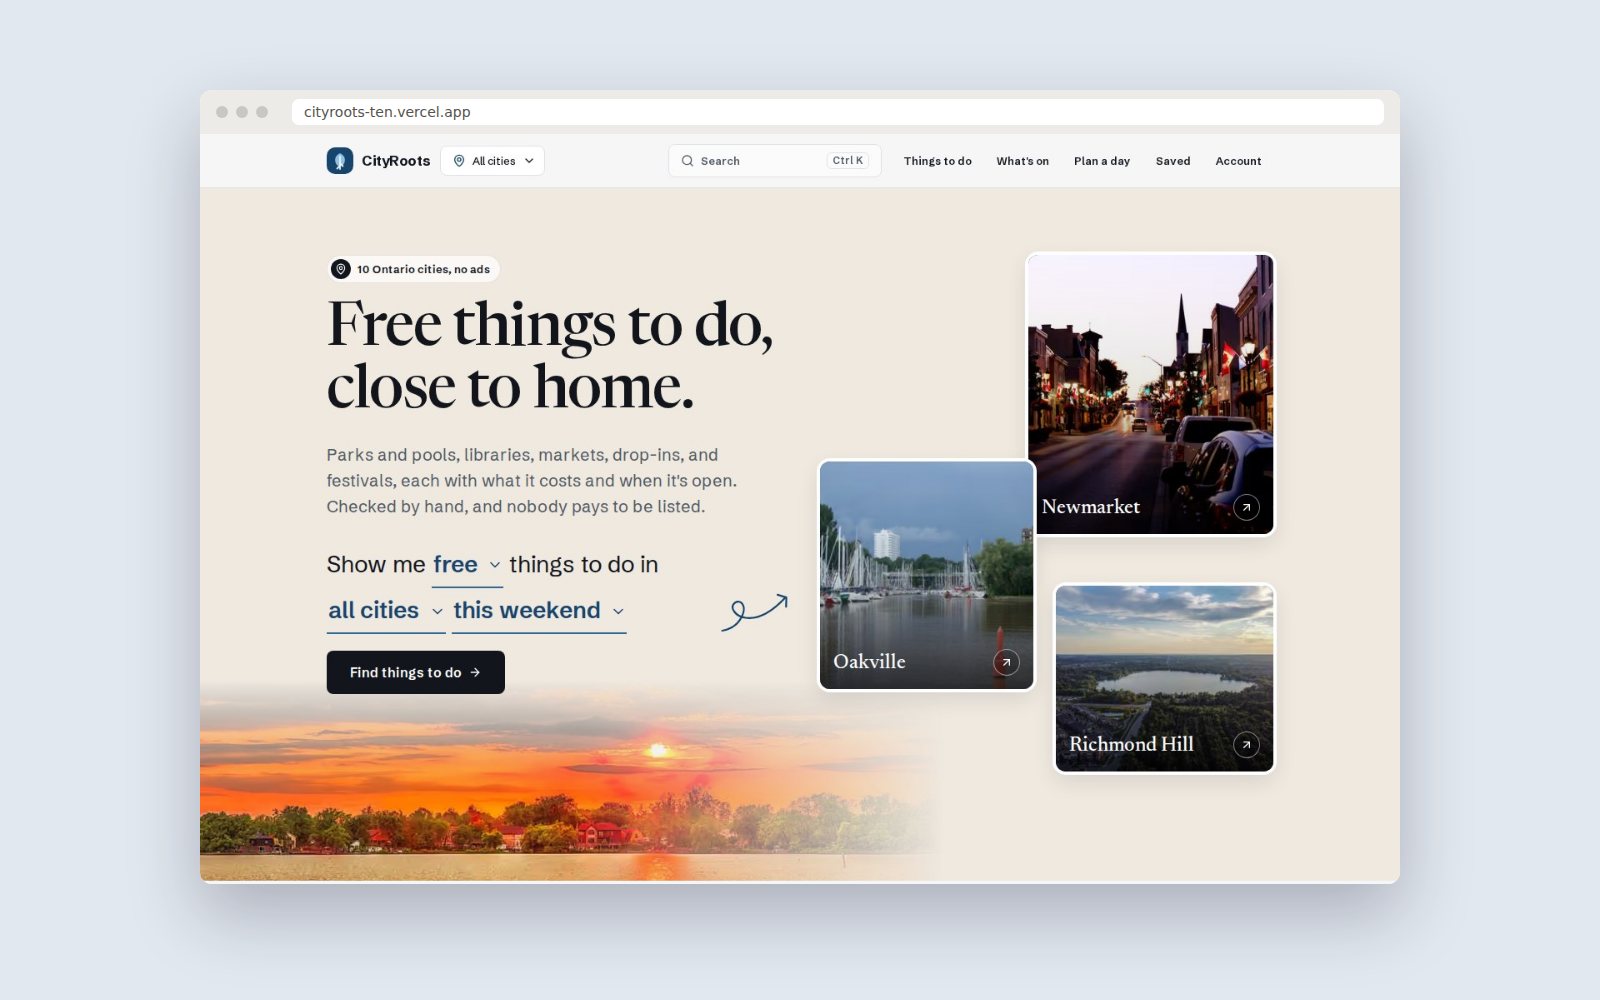
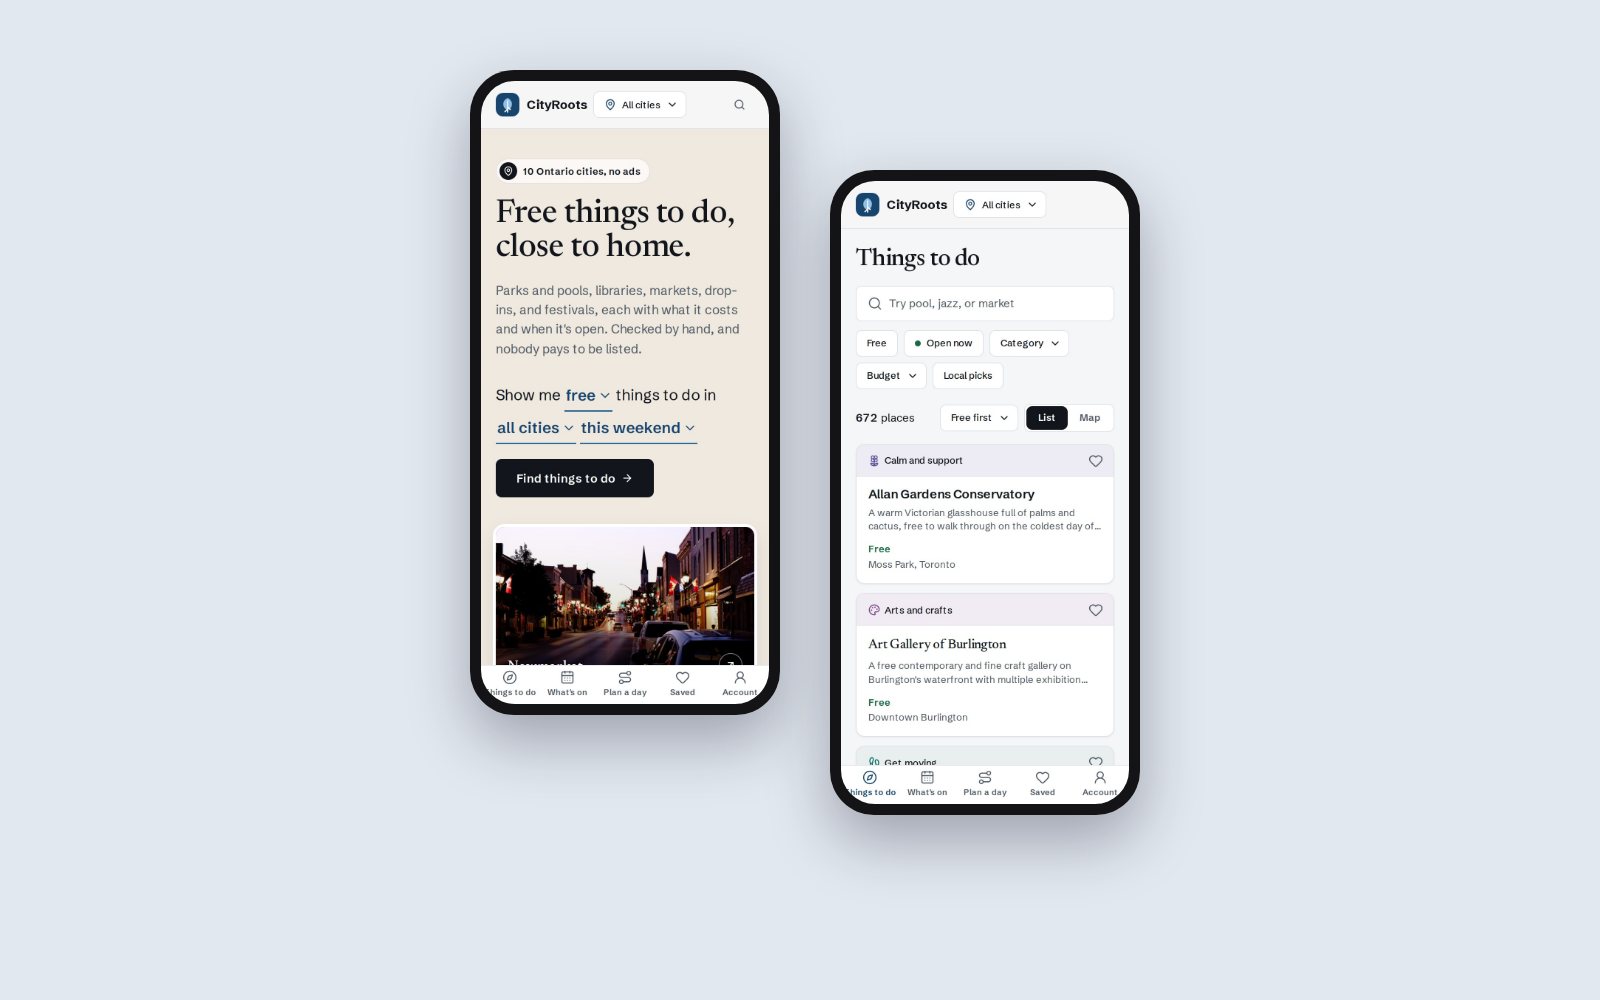
Screens captured from the live site, shown in device frames.
What I found, and what it changed
- Who it's for
- Budget-conscious locals, newcomers, families, and young adults looking to meet people. This was desk research: published surveys and what already exists, not interviews.
- Cost comes first
- Two-thirds of Canadians plan to cut spending, and 44% plan to spend less on entertainment (TD and Harris, 2026). So cost is the first fact on every card, and free is one tap away.
- People want company
- 89% want events that connect them to a community (Eventbrite, 2026). So Meet people is a top-level category, not a tag.
- Plans travel by link
- 64% of Gen Z find things to do on social feeds (Eventbrite, 2025). So every filter, place and plan has an address you can send to someone.
- The gap
- Neighbours like GetMovingTO and the Toronto Event Generator newsletter each cover one slice. Nobody had one checked source with the cost on every line.
Concept and interaction design
The idea
Show the product instead of describing it. The home page leads with one sentence you can change, 'Show me free things to do in all cities this weekend', which works as a plain form without JavaScript, next to photos of real cities. Under it: four counts that are true and say what they mean, each category with three real places, this week's events, and a sample Saturday built by the same code as the planner, so the preview is never a mock-up.
- Every filter is a link
- Four rows of filter chips filled most of a phone screen, so each one became a small menu. Every option is still a real link, so the explorer works without JavaScript and a shared address shows the same list.
- Each category looks like what it is
- Every card looked the same, so the categories blurred together. Now each takes a form that suits what people want from it: Calm and support is one quiet column with the phone number in reach, Meet people is a notice board, Food is a menu, and festivals are posters led by the date.
- Look without losing your place
- People compare several places, and they kept losing their spot in the list. Cards now open a preview over the list. Back closes it, and a reload keeps it.
- Save first, sign up later
- The heart saves a place with no account. Asking for an email before someone had saved anything lost the moment.
- A missing badge beats a wrong one
- 'Open now' only appears when the hours read cleanly. A wrong one sends someone to a locked door. Events known only by month say 'Usually in June', never a made-up date.
Product design
The first look, cream paper, forest green and Fraunces, is a very common template, so I moved it to a cool white page, blue-black ink and lake blue for the brand. That leaves green meaning only one thing: free. The home page follows an editorial city-portal layout I chose as a reference, filled with CityRoots' own content and photos. It all runs on design tokens and a library of UI primitives, so the whole theme changed without touching a page. See it with the other designs.
- Type
- Newsreader for headlines, Schibsted Grotesk for text
- Colour
- Lake blue brand on cool paper; green means free
- System
- Design tokens and a library of UI primitives
- Checks
- Playwright runs axe against a production build
How it fits together
Data. Modelled places, events, cost bands and weekly hours in Postgres with Drizzle migrations (Neon in production, PGlite locally).
Read all 5 steps at once
- Data. Modelled places, events, cost bands and weekly hours in Postgres with Drizzle migrations (Neon in production, PGlite locally).
- Ranking. Wrote ranking as tested TypeScript that puts free listings first.
- Product. Built the MapLibre explorer, search, event calendar, collections and a Day Planner that works as a pure, unit-tested function.
- Operations. Added an admin review queue, rate limiting, and Stripe subscriptions with signed webhooks.
- CI. Formatting, lint, typecheck, unit and end-to-end tests, axe accessibility checks, a migration dry run, and Lighthouse on 12 URLs.
Working within limits
I'm the engineer too, so the limits showed up early. The map library is about 280 KB, so the list is the default and the map loads only when you ask for it. The header shows a plain Account link instead of who's signed in, because reading the session there would slow down every page.
How I checked it
- A test for trust
- ranking-integrity.test.ts fails if the ranking code, or the signals the explorer feeds it, mentions payment, subscription, tier, partner, claim, sponsorship or promotion.
- A friction pass at real sizes
- I measured every page on a 390px phone and at 1280px before changing anything. It led to one name per thing, one search box per page, 44px tap areas, and the plan coming before the settings in the planner.
- Accessibility, checked
- Playwright runs axe against a production build, and a palette test holds all 11 category colours to AA contrast in light and dark.
- Sources, checked
- An audit of the hand-written listings found 37 dead links and 35 domains that don't load. A listing now stays only if a live page or an official dataset names it.
I haven't run a usability test with real people yet, so none of this is user testing.
Results
- dead links and dead domains found when I audited 400 listings, so those came out
- 72
- category colours, each passing AA contrast in light and dark
- 11
- day guides, one per city, every stop a live listing
- 10
What I learned
What I learned
Trust is a design problem before it's a visual one. The thing people need to believe, that the order is fair, had to be true in the code first, and a test is the only way I know to keep it true after I stop looking.
What I'd do differently
Put it in front of people sooner. Everything here came from desk research and my own friction pass. I'd rather have watched five people plan a Saturday on it before the rebuild.
How I used AI
- How I built it
- With Claude Code, one phase at a time from a written spec, with a review after each phase. Every judgment call is written down with its reason in the repo's DECISIONS.md.
- What I sent back
- The spec asked for a live counter strip and rows of three icon cards. Once I saw them built, I had both taken out. Counts came back later as four fact cards, only once each one was true and said what it means. Inlining the CSS was tried and reverted when it made the home page slower to appear.
- What stayed mine
- What ranking is allowed to read, which listings to keep, and calls like measuring the speed budget on regular 4G.
Properties
- Type
- Web app
- Role
- Solo, product design and development
- Year
- 2026
- Stack
- Next.js, TypeScript, PostgreSQL, Drizzle ORM, Auth.js, Stripe, Playwright, Vitest
- Also shows
- Testing, Product design, Interaction design, Design tokens, Responsive design, Accessibility (WCAG AA)
- Status
- Live; own domain and live payments still to come