Case study 04 / Content and design / 2025
SpurHacks
23 reels and a set of Figma graphics for a 1,400+ person hackathon.
I made the event's reels and worked on its graphics, planning week by week and changing course when the numbers said to.
993K+views across 23 reels
Role, status and stack
- Role
- Marketing Coordinator (Volunteer) at Konfer
- Status
- Event ran June 20 to 22, 2025
- Made with
- Instagram / Notion / Figma
The problem
Make more of what people share, and don't get attached to what you assumed.
SpurHacks is Canada's largest in-person hackathon by project submissions: three days, four floors of the old BlackBerry campus in Waterloo, and 1,400+ attendees. Before any of that, students had to hear about it and apply. That was my part.
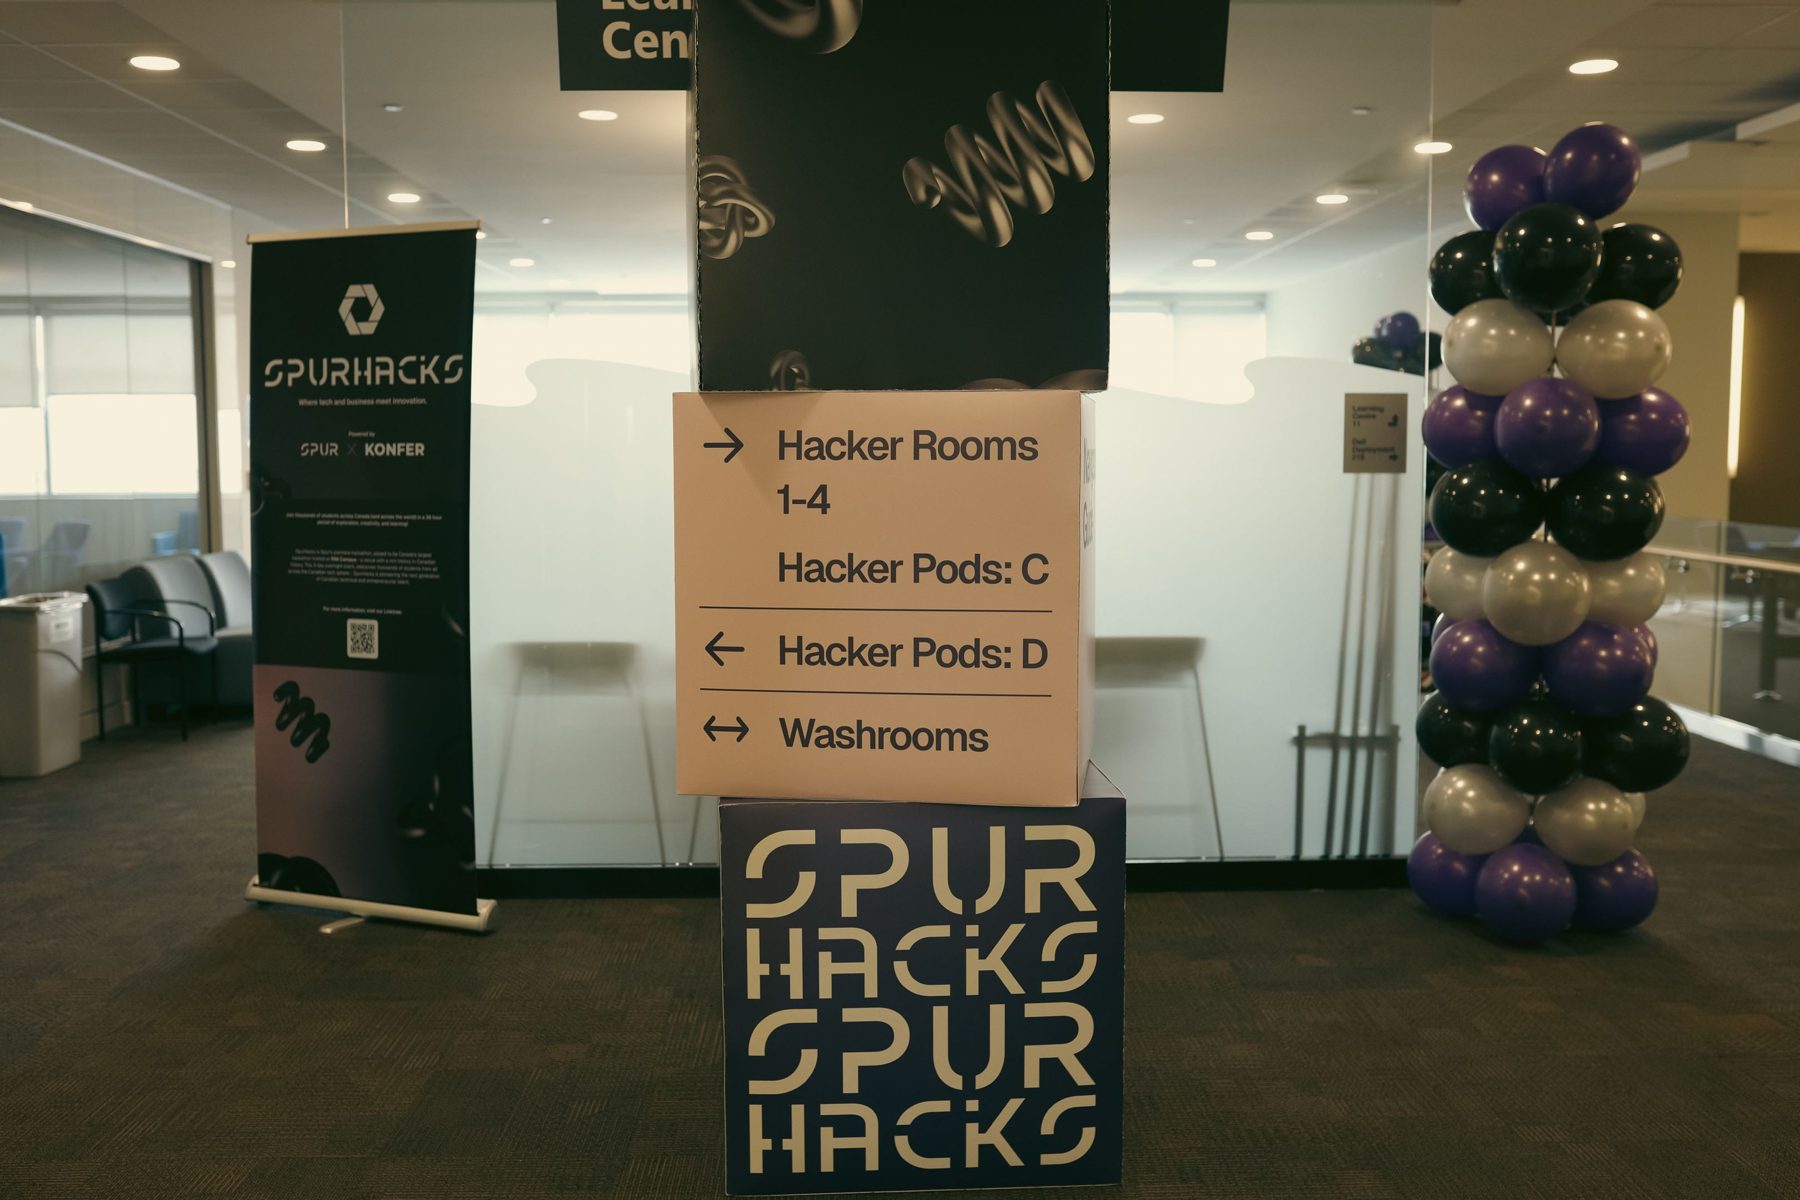
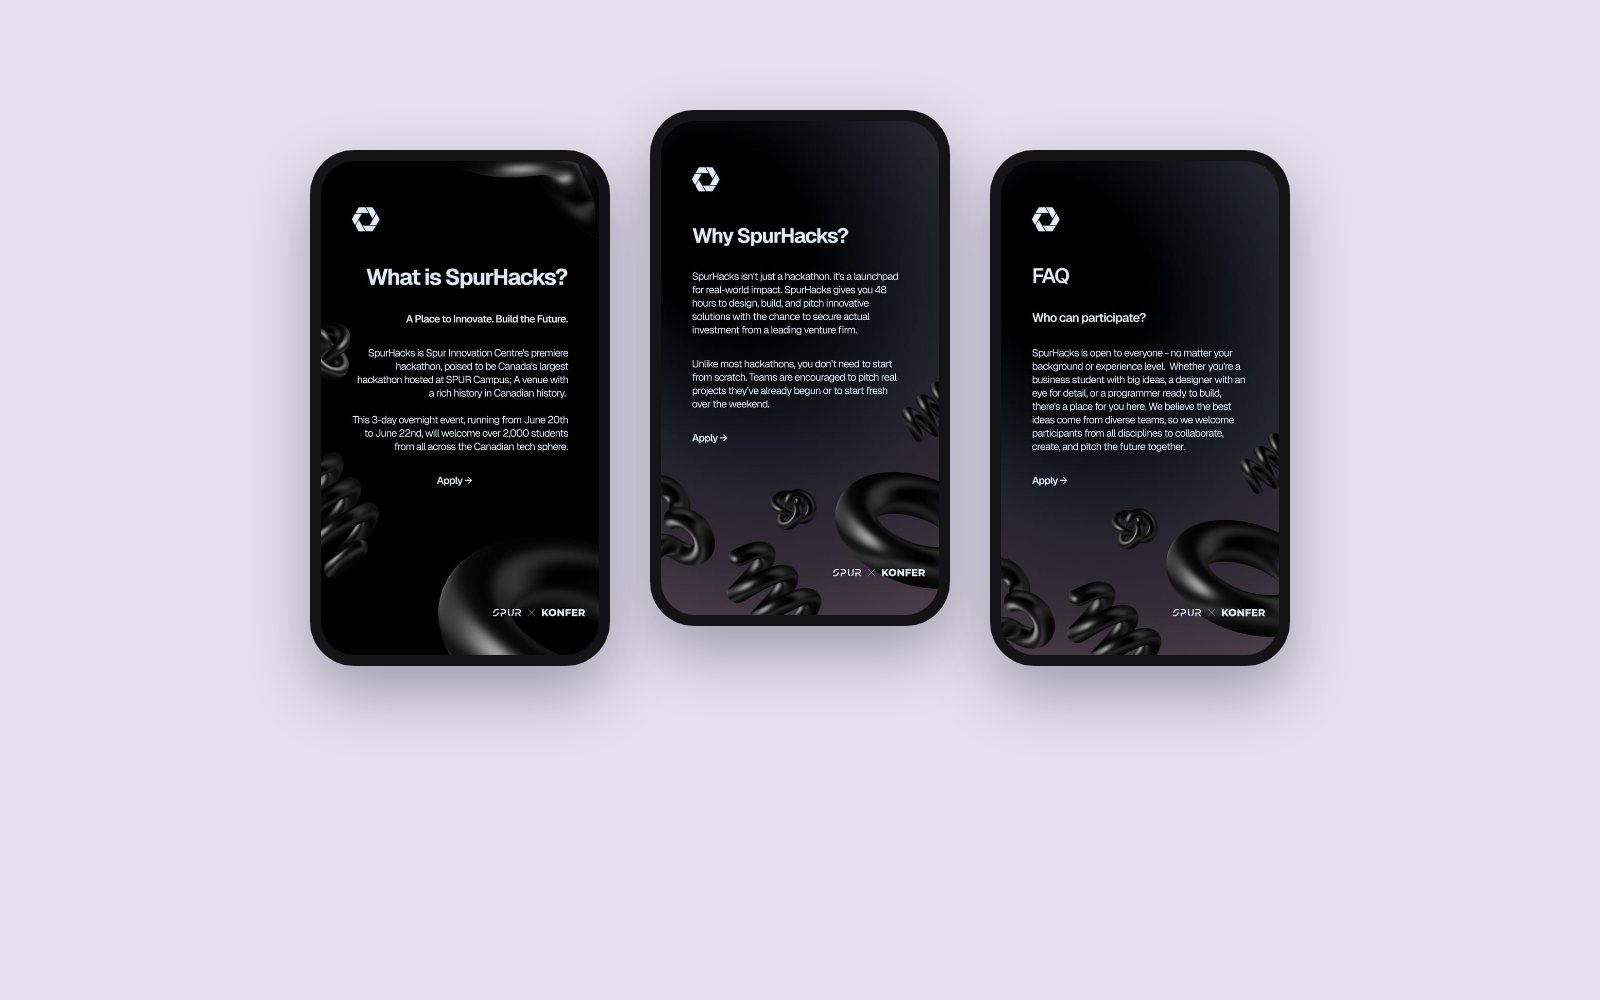
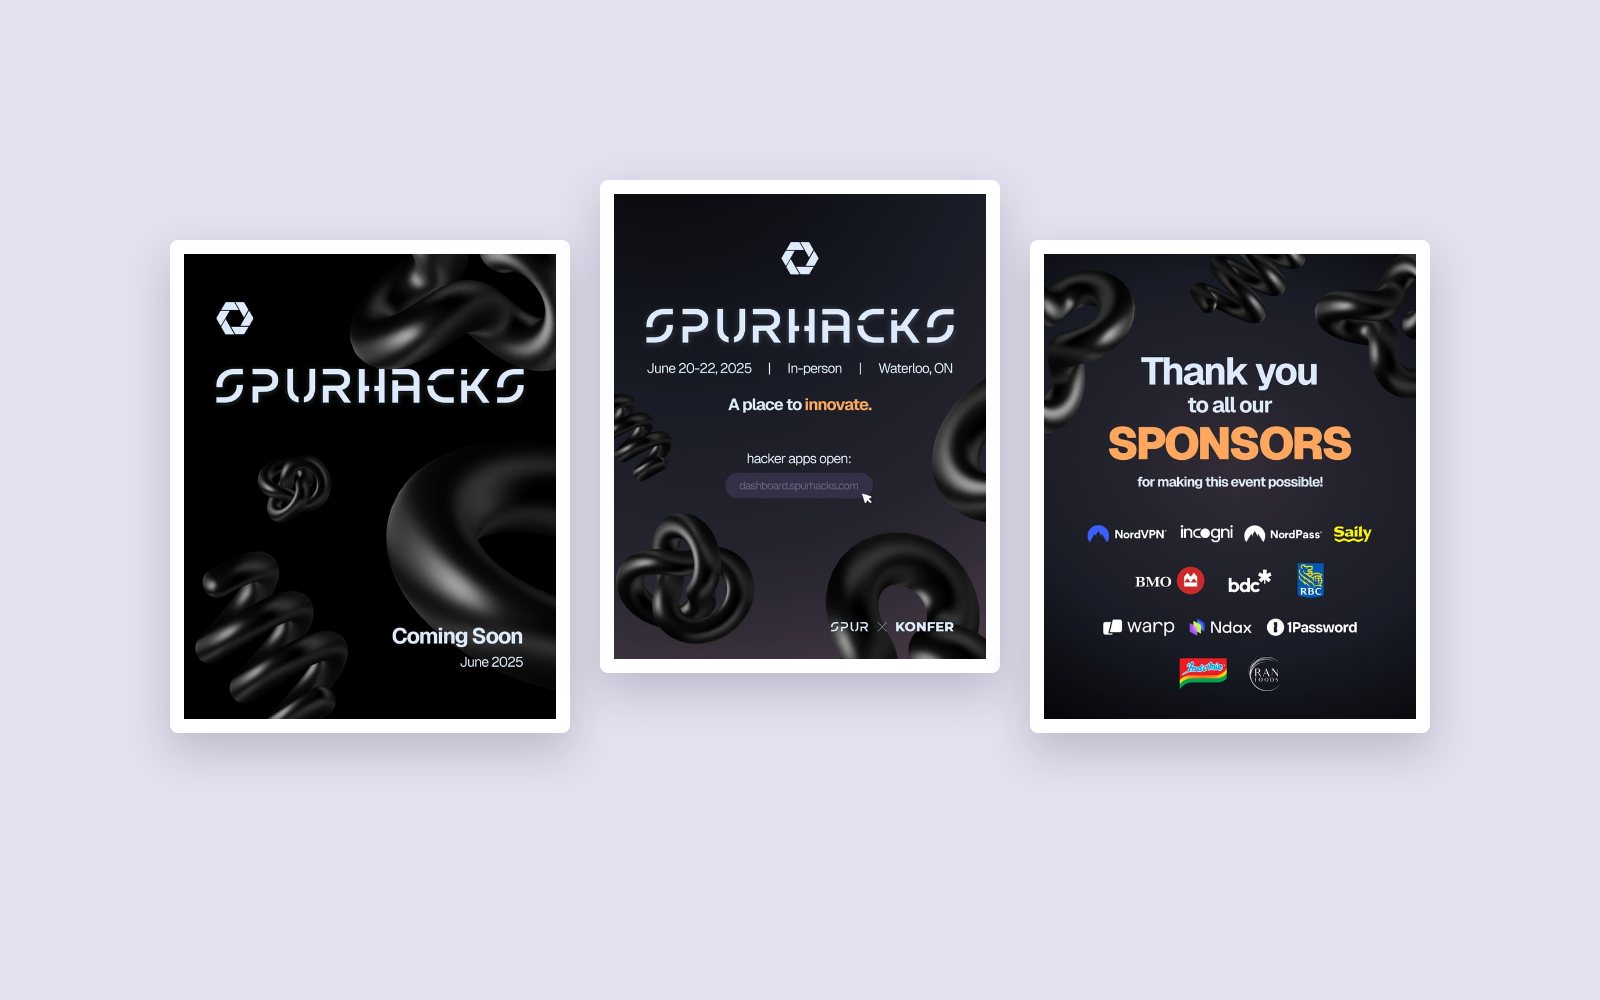
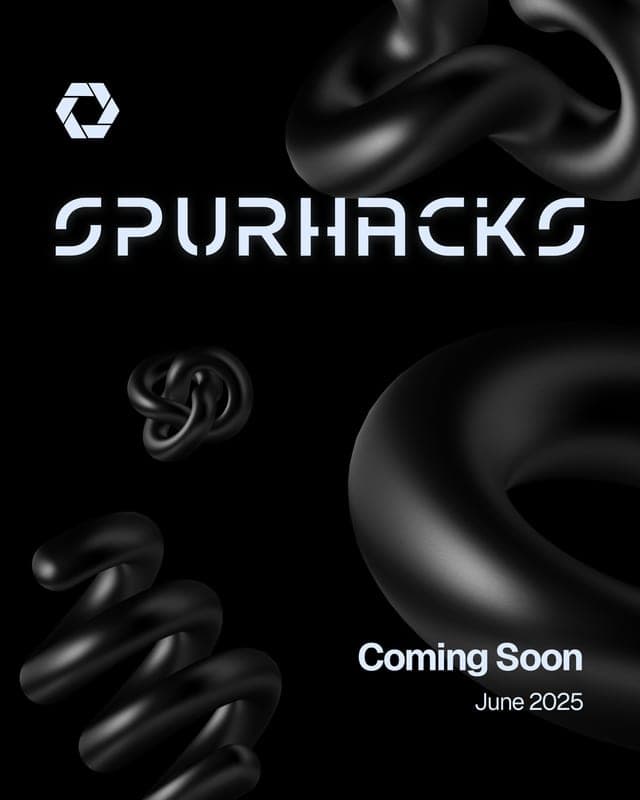
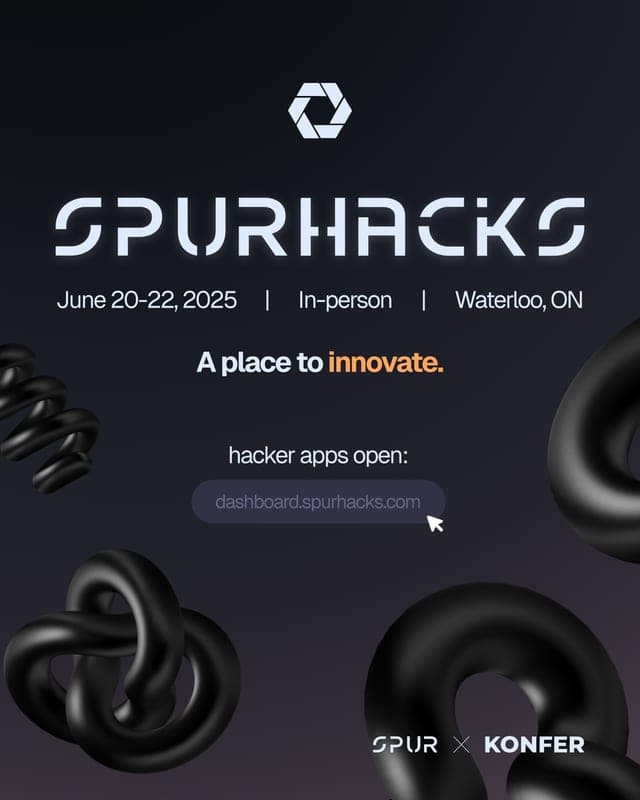
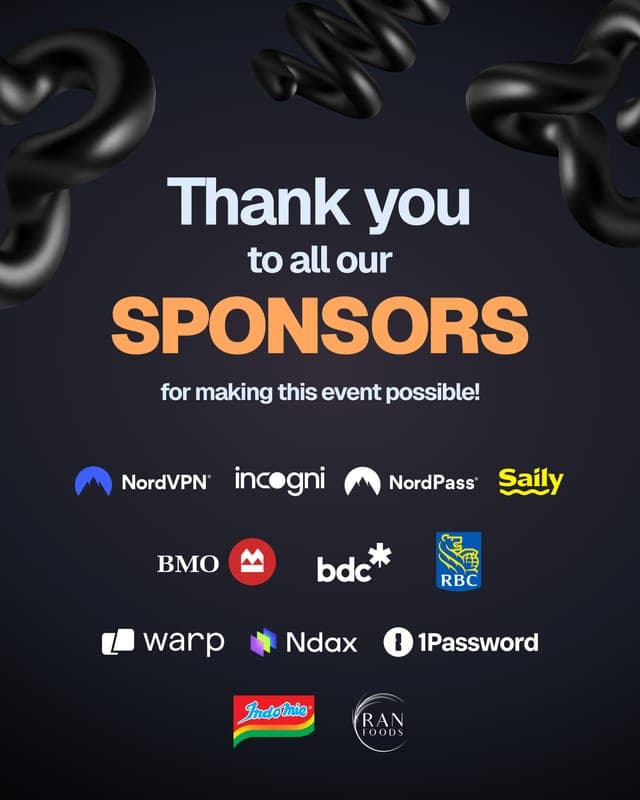
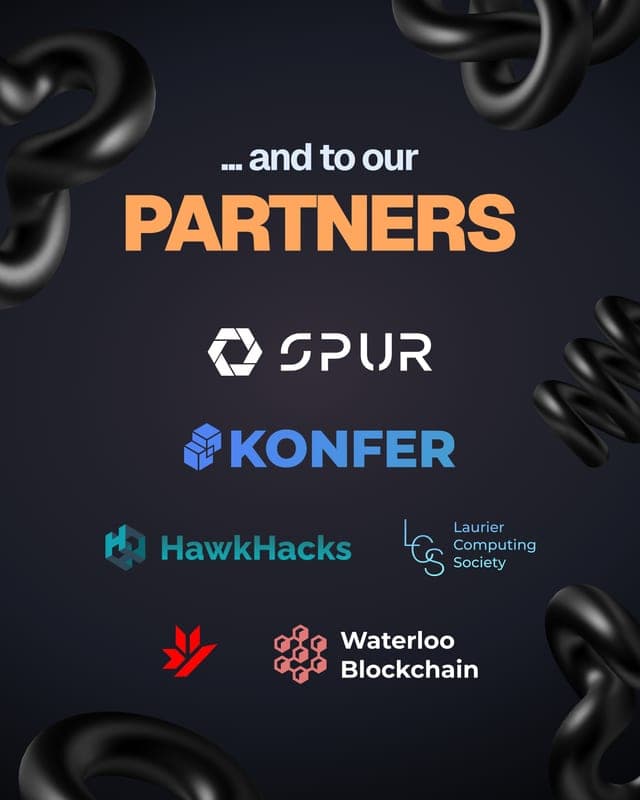
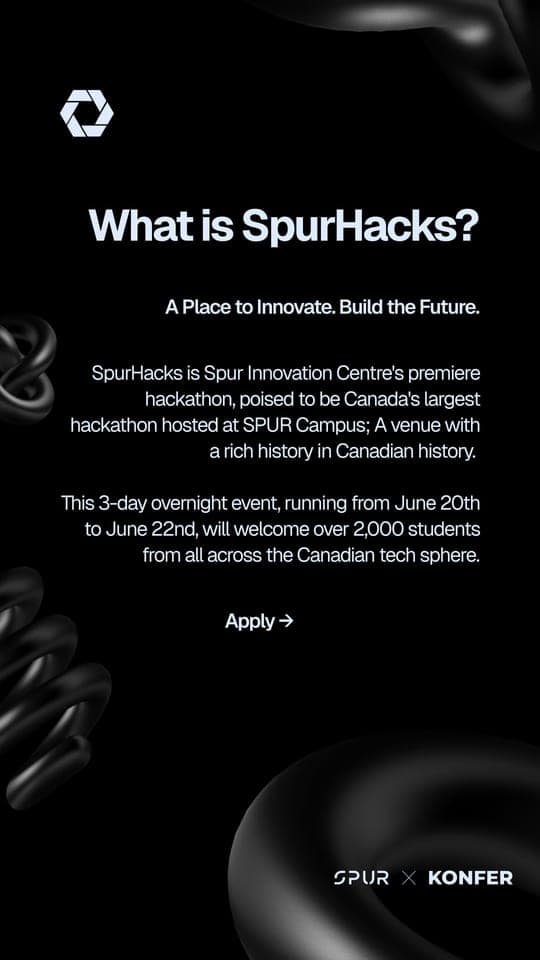
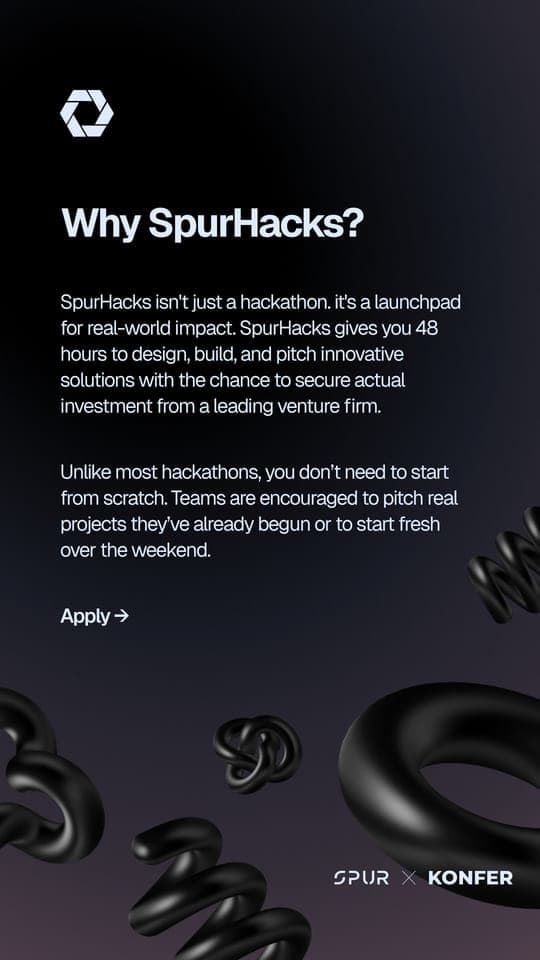
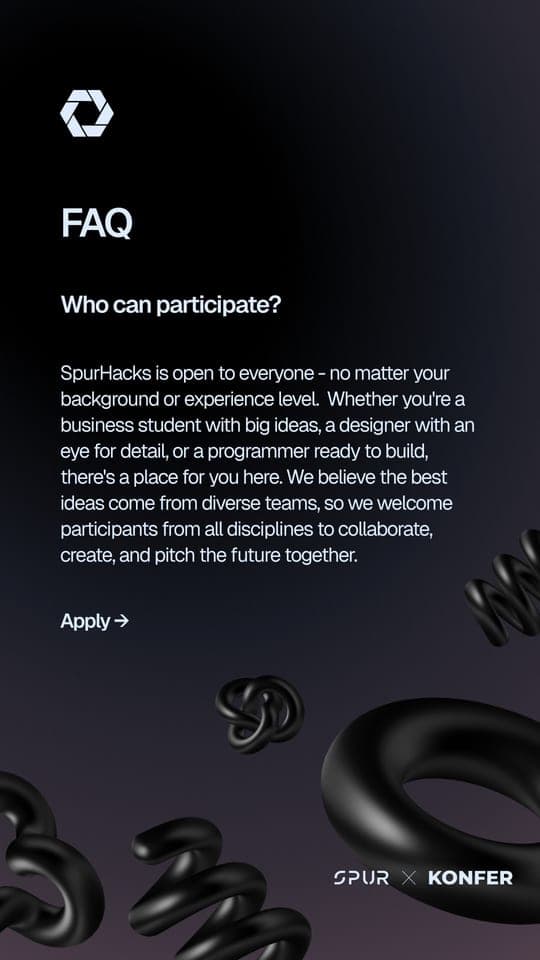
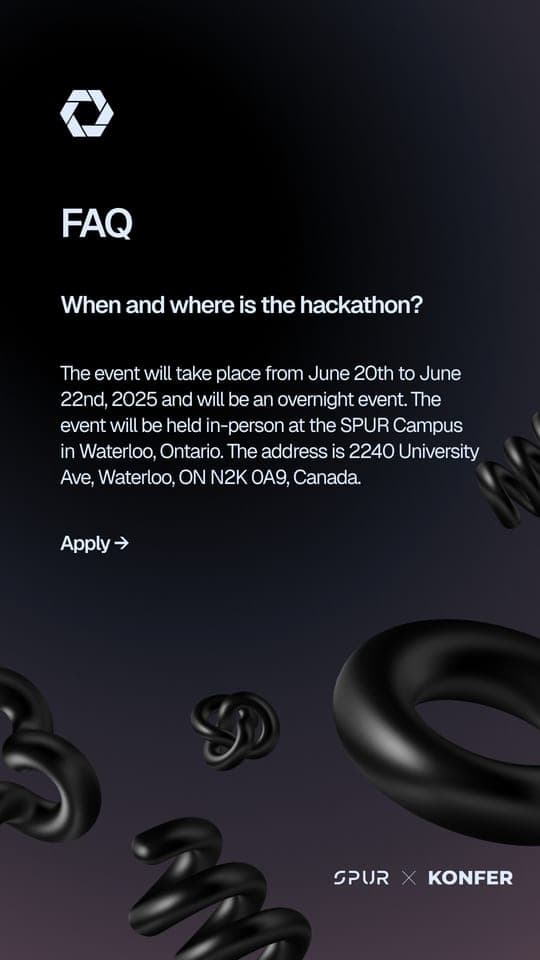
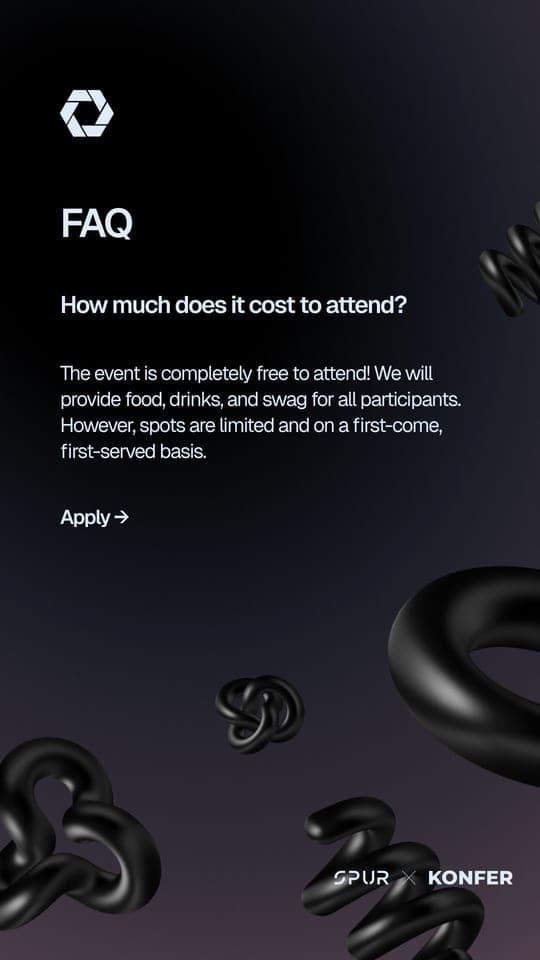
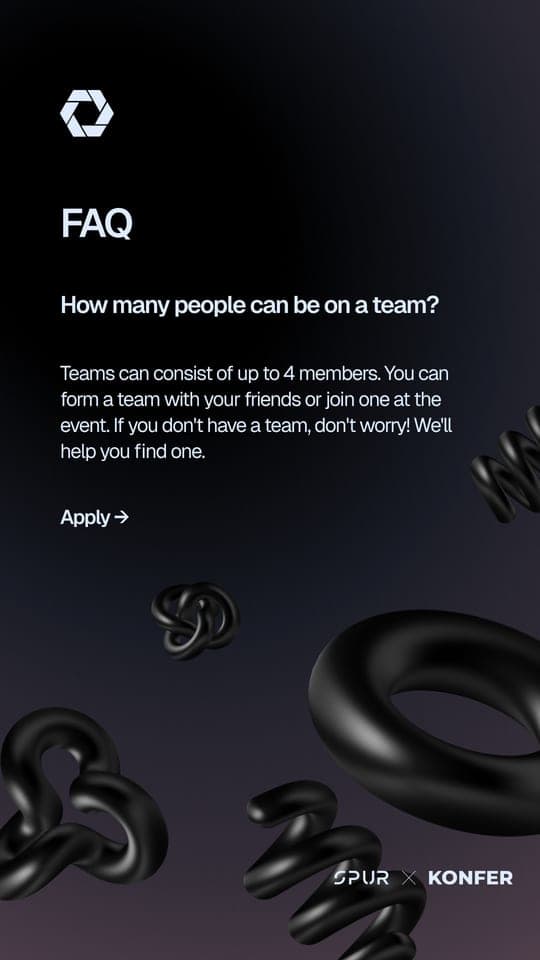
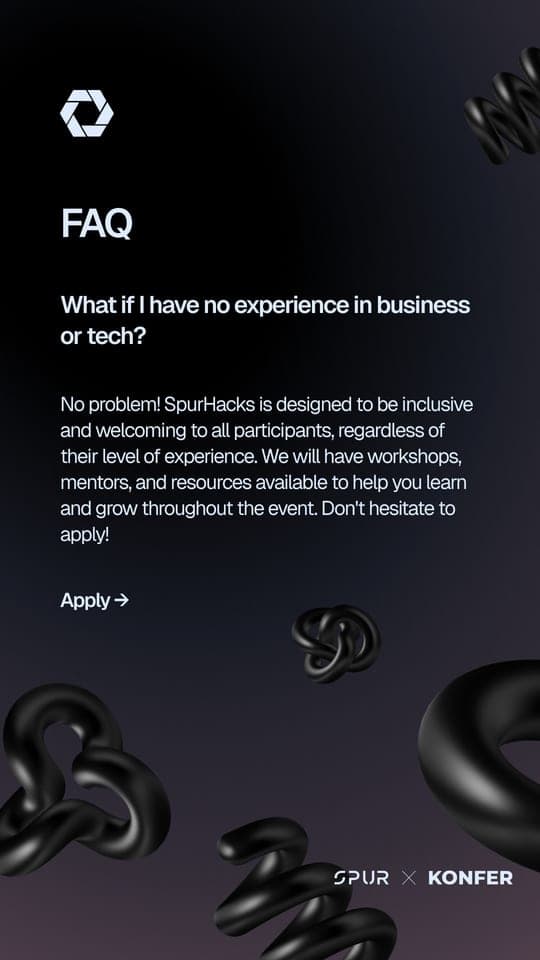
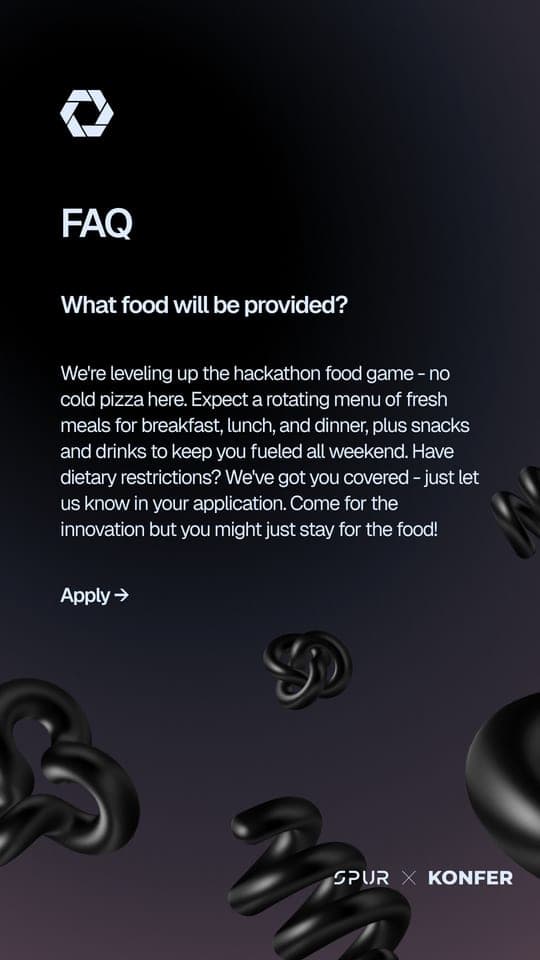
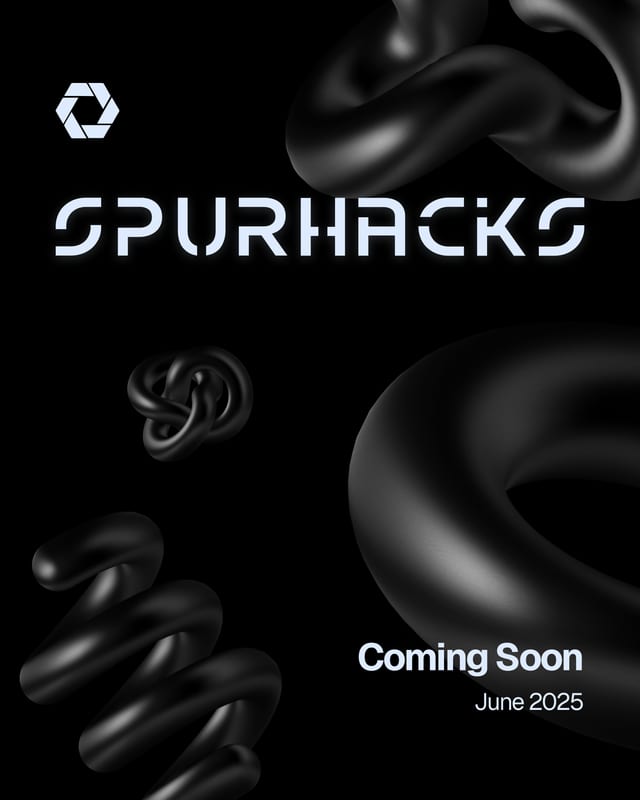
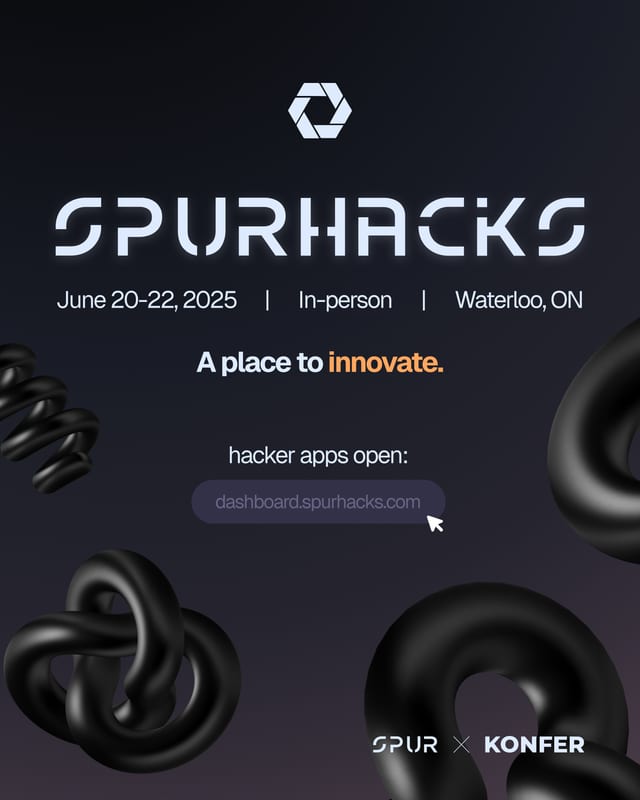
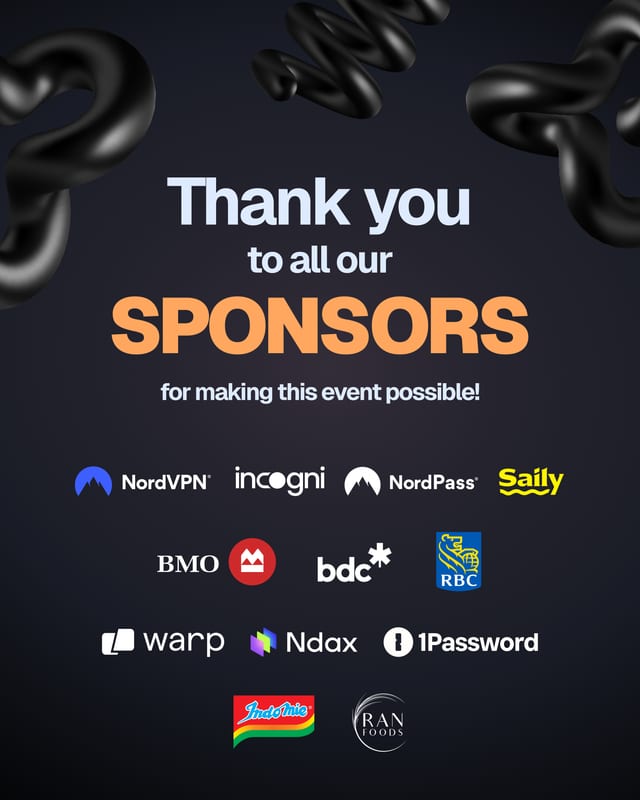
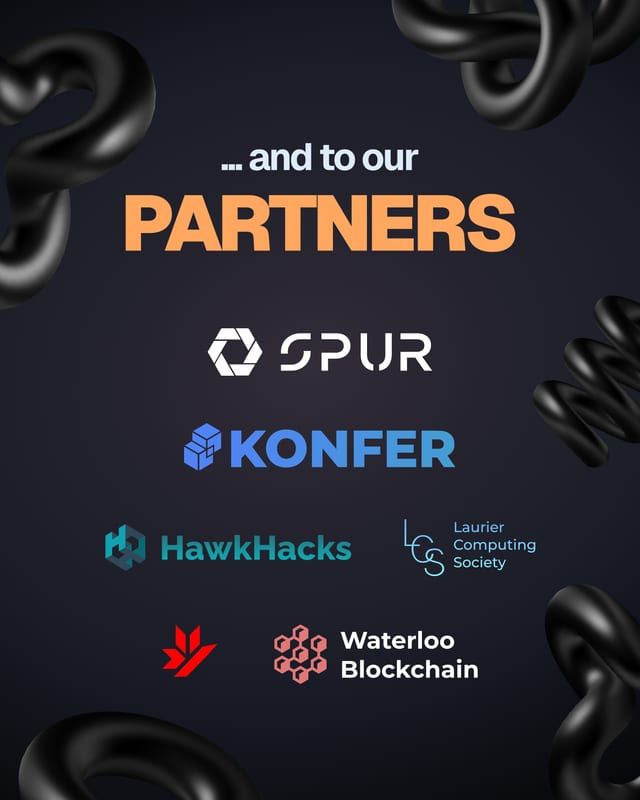
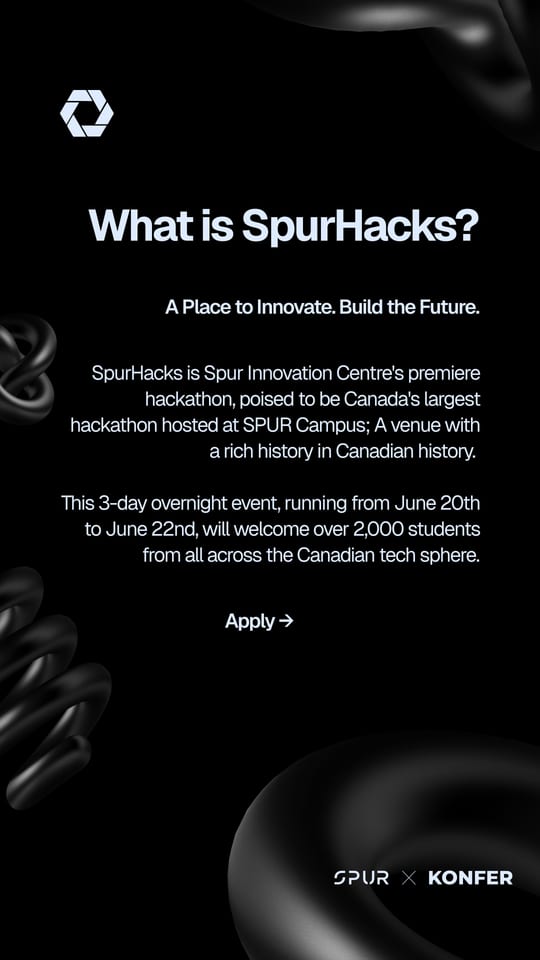
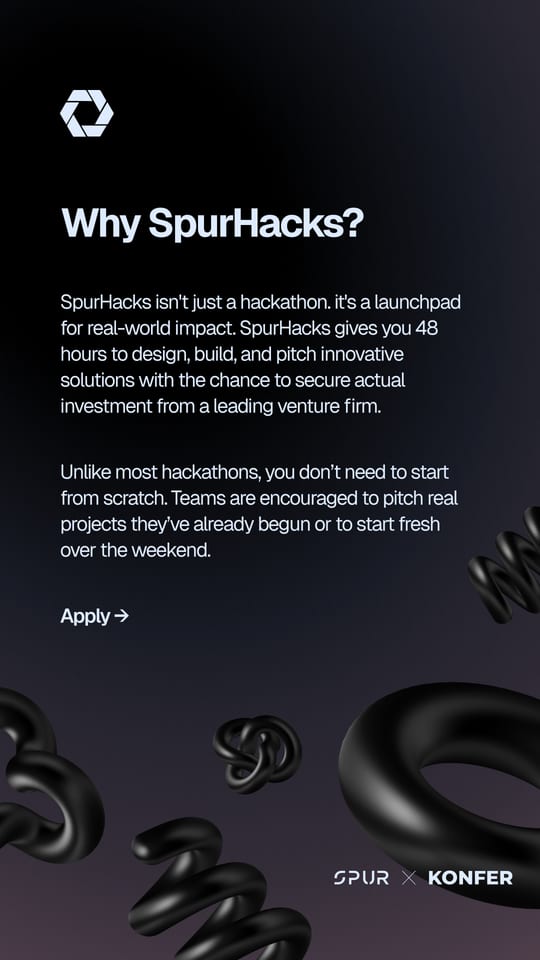
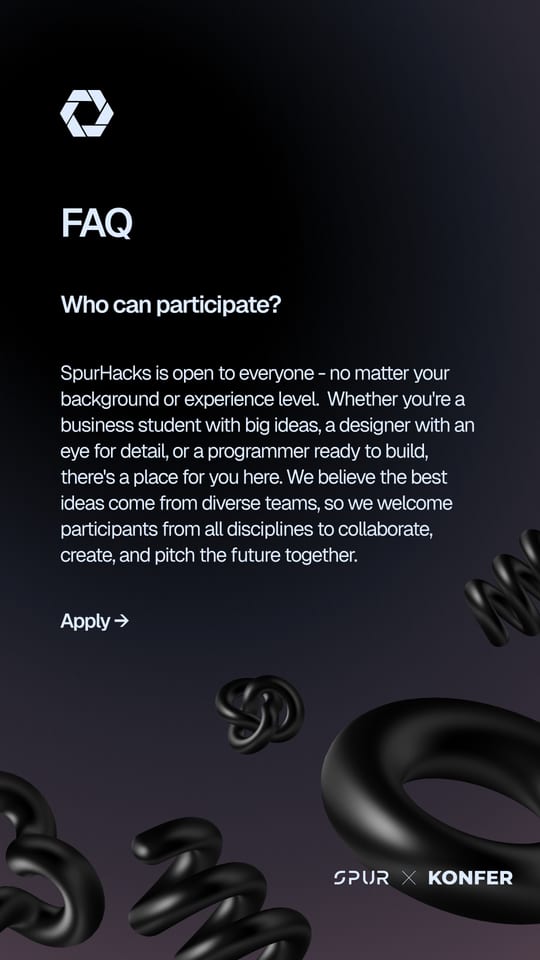
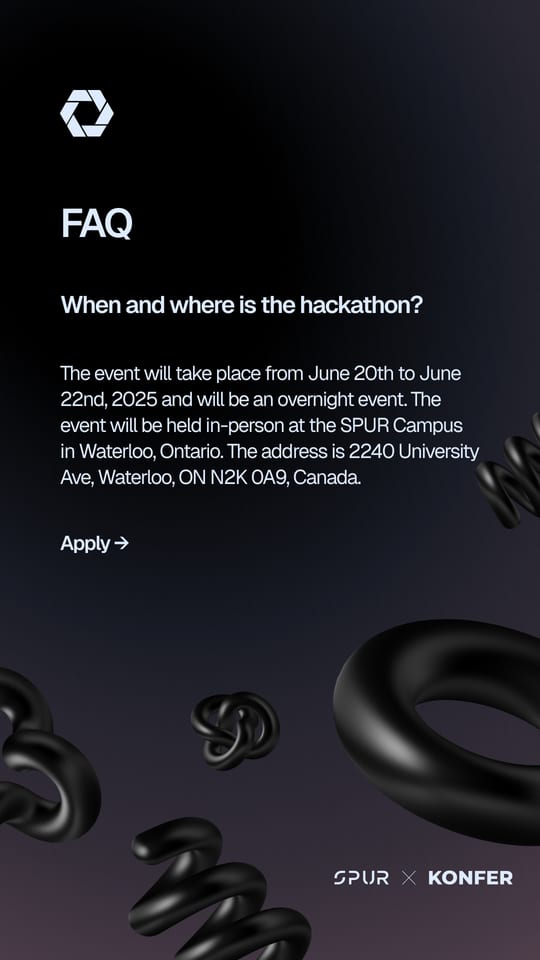
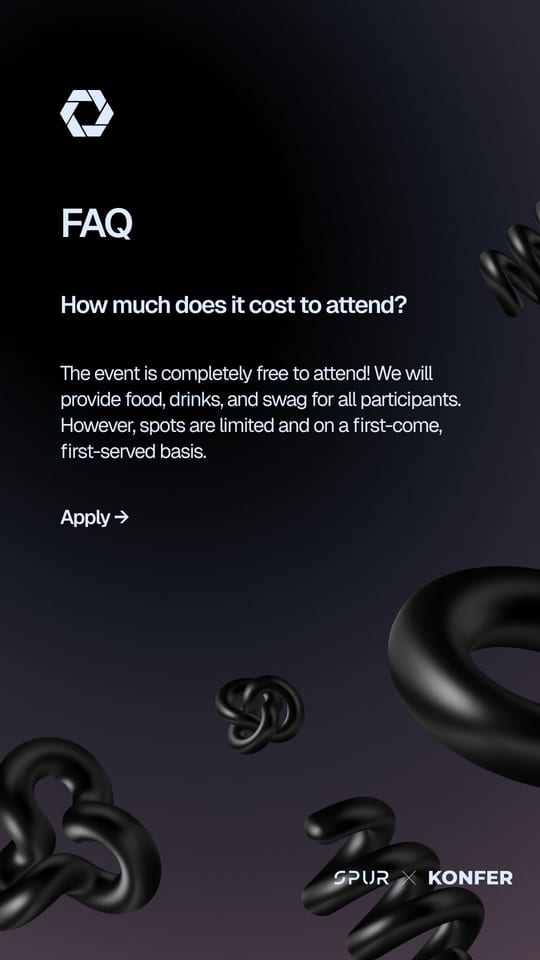
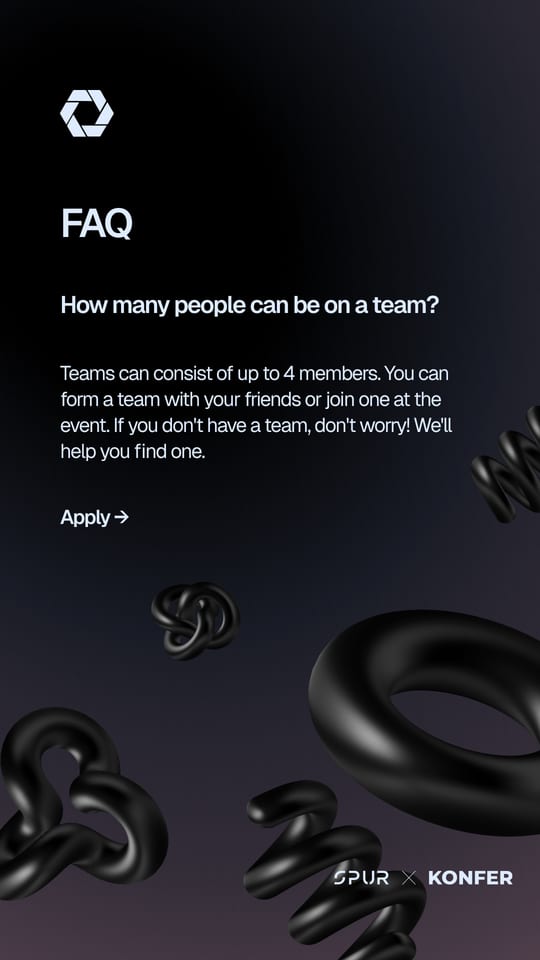
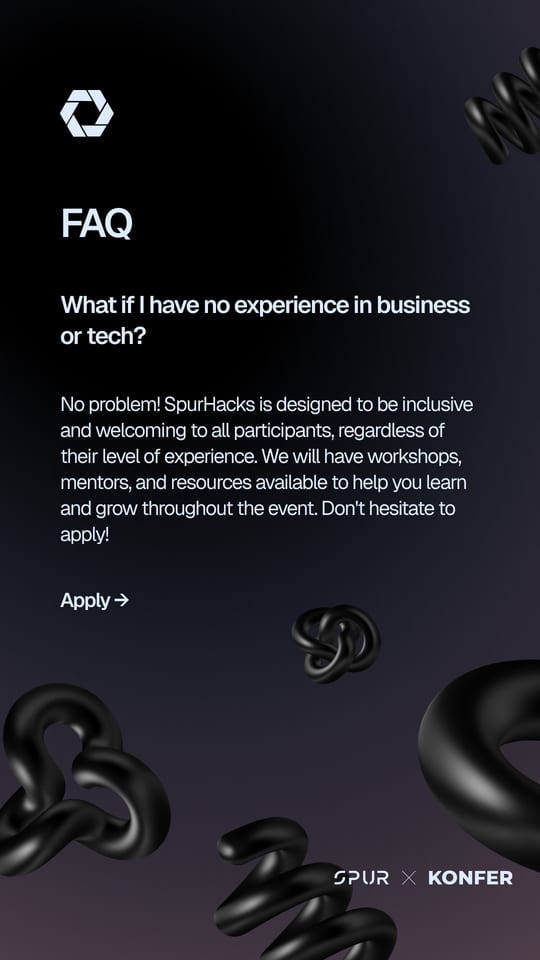
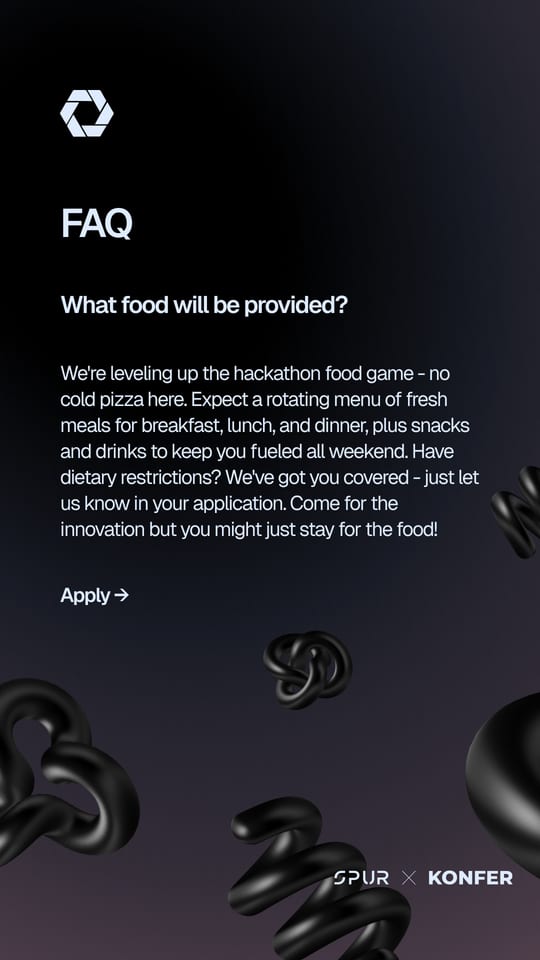
Campaign graphics shown in frames. They were made in Figma with the team's graphic designer.
What I did
Planning
A week-by-week content calendar: awareness, then interest, then the registration deadline.
Making
Produced and edited short-form reels. Recaps, team moments and behind-the-scenes clips did the most.
Graphics
In Figma with the team's graphic designer, writing copy and editing layouts in their templates.
Reading the analytics
Pulled Instagram analytics weekly: reach, non-follower share, shares and saves.
Changing course
Dropped formats that plateaued at 2,000 to 4,000 views, and made more of what people shared.
On site
Worked with the 100+ person volunteer team on event-day logistics and communications.
Results
- 23reels
- 993K+total views
- 816K+on the top reel
- 2,279applications during the campaign
- day-of sign-ins
- 1,016
- tickets issued
- 1,174
Contact sheet
Story and feed graphics, made in Figma with the team's graphic designer. I wrote the copy and edited layouts in their templates.
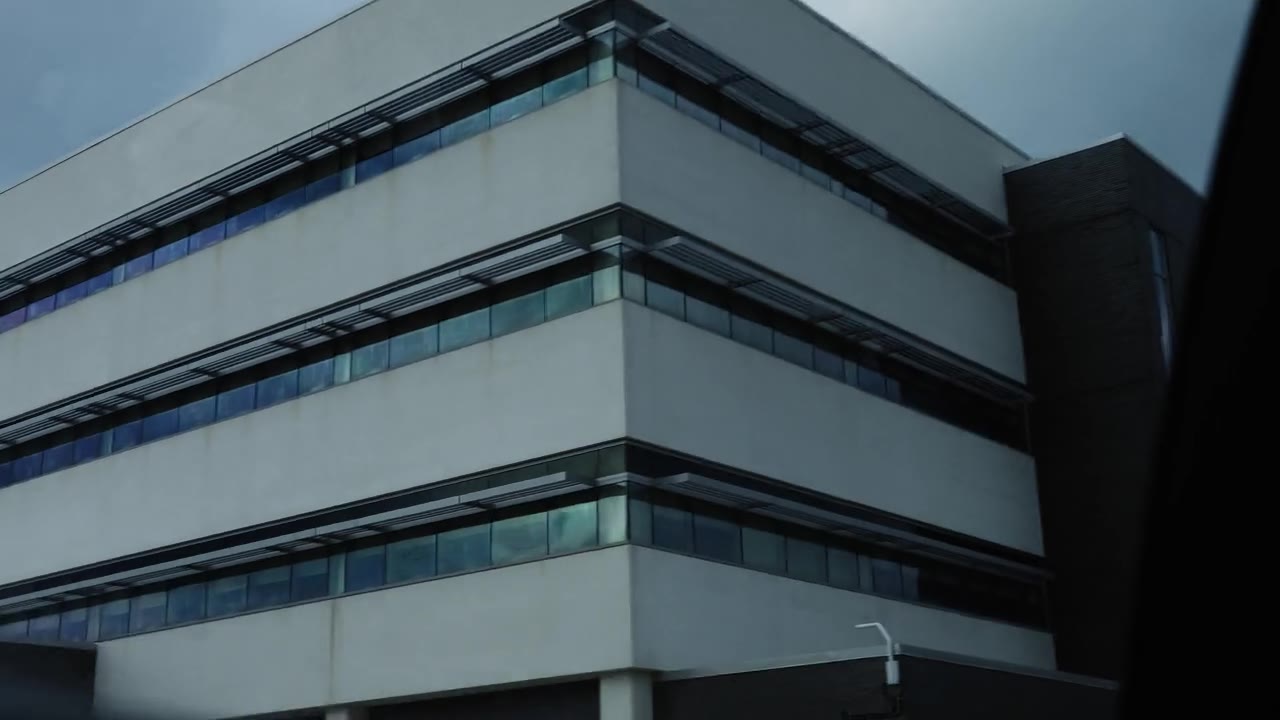
More on the Design page →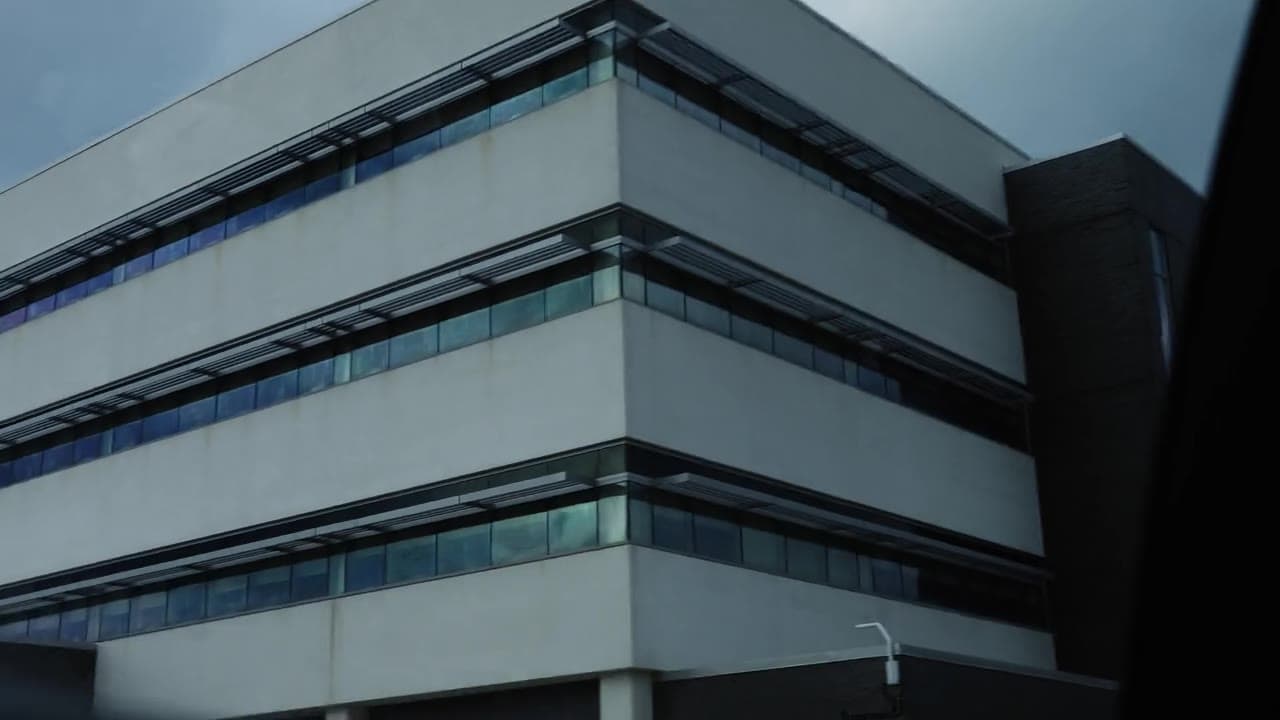 Teaser video frame
What I learned
What I learned
One reel accounted for most of the views, which is a good reason not to confuse a hit with a system. Applications came in alongside the content. I can't separate how much of one caused the other, so I won't claim it.
Properties
- Type
- Content + design
- Role
- Marketing Coordinator (Volunteer) at Konfer
- Year
- 2025
- Also shows
- Graphic design, Social content, Short-form video, Microsoft PowerPoint
- Status
- Event ran June 20 to 22, 2025